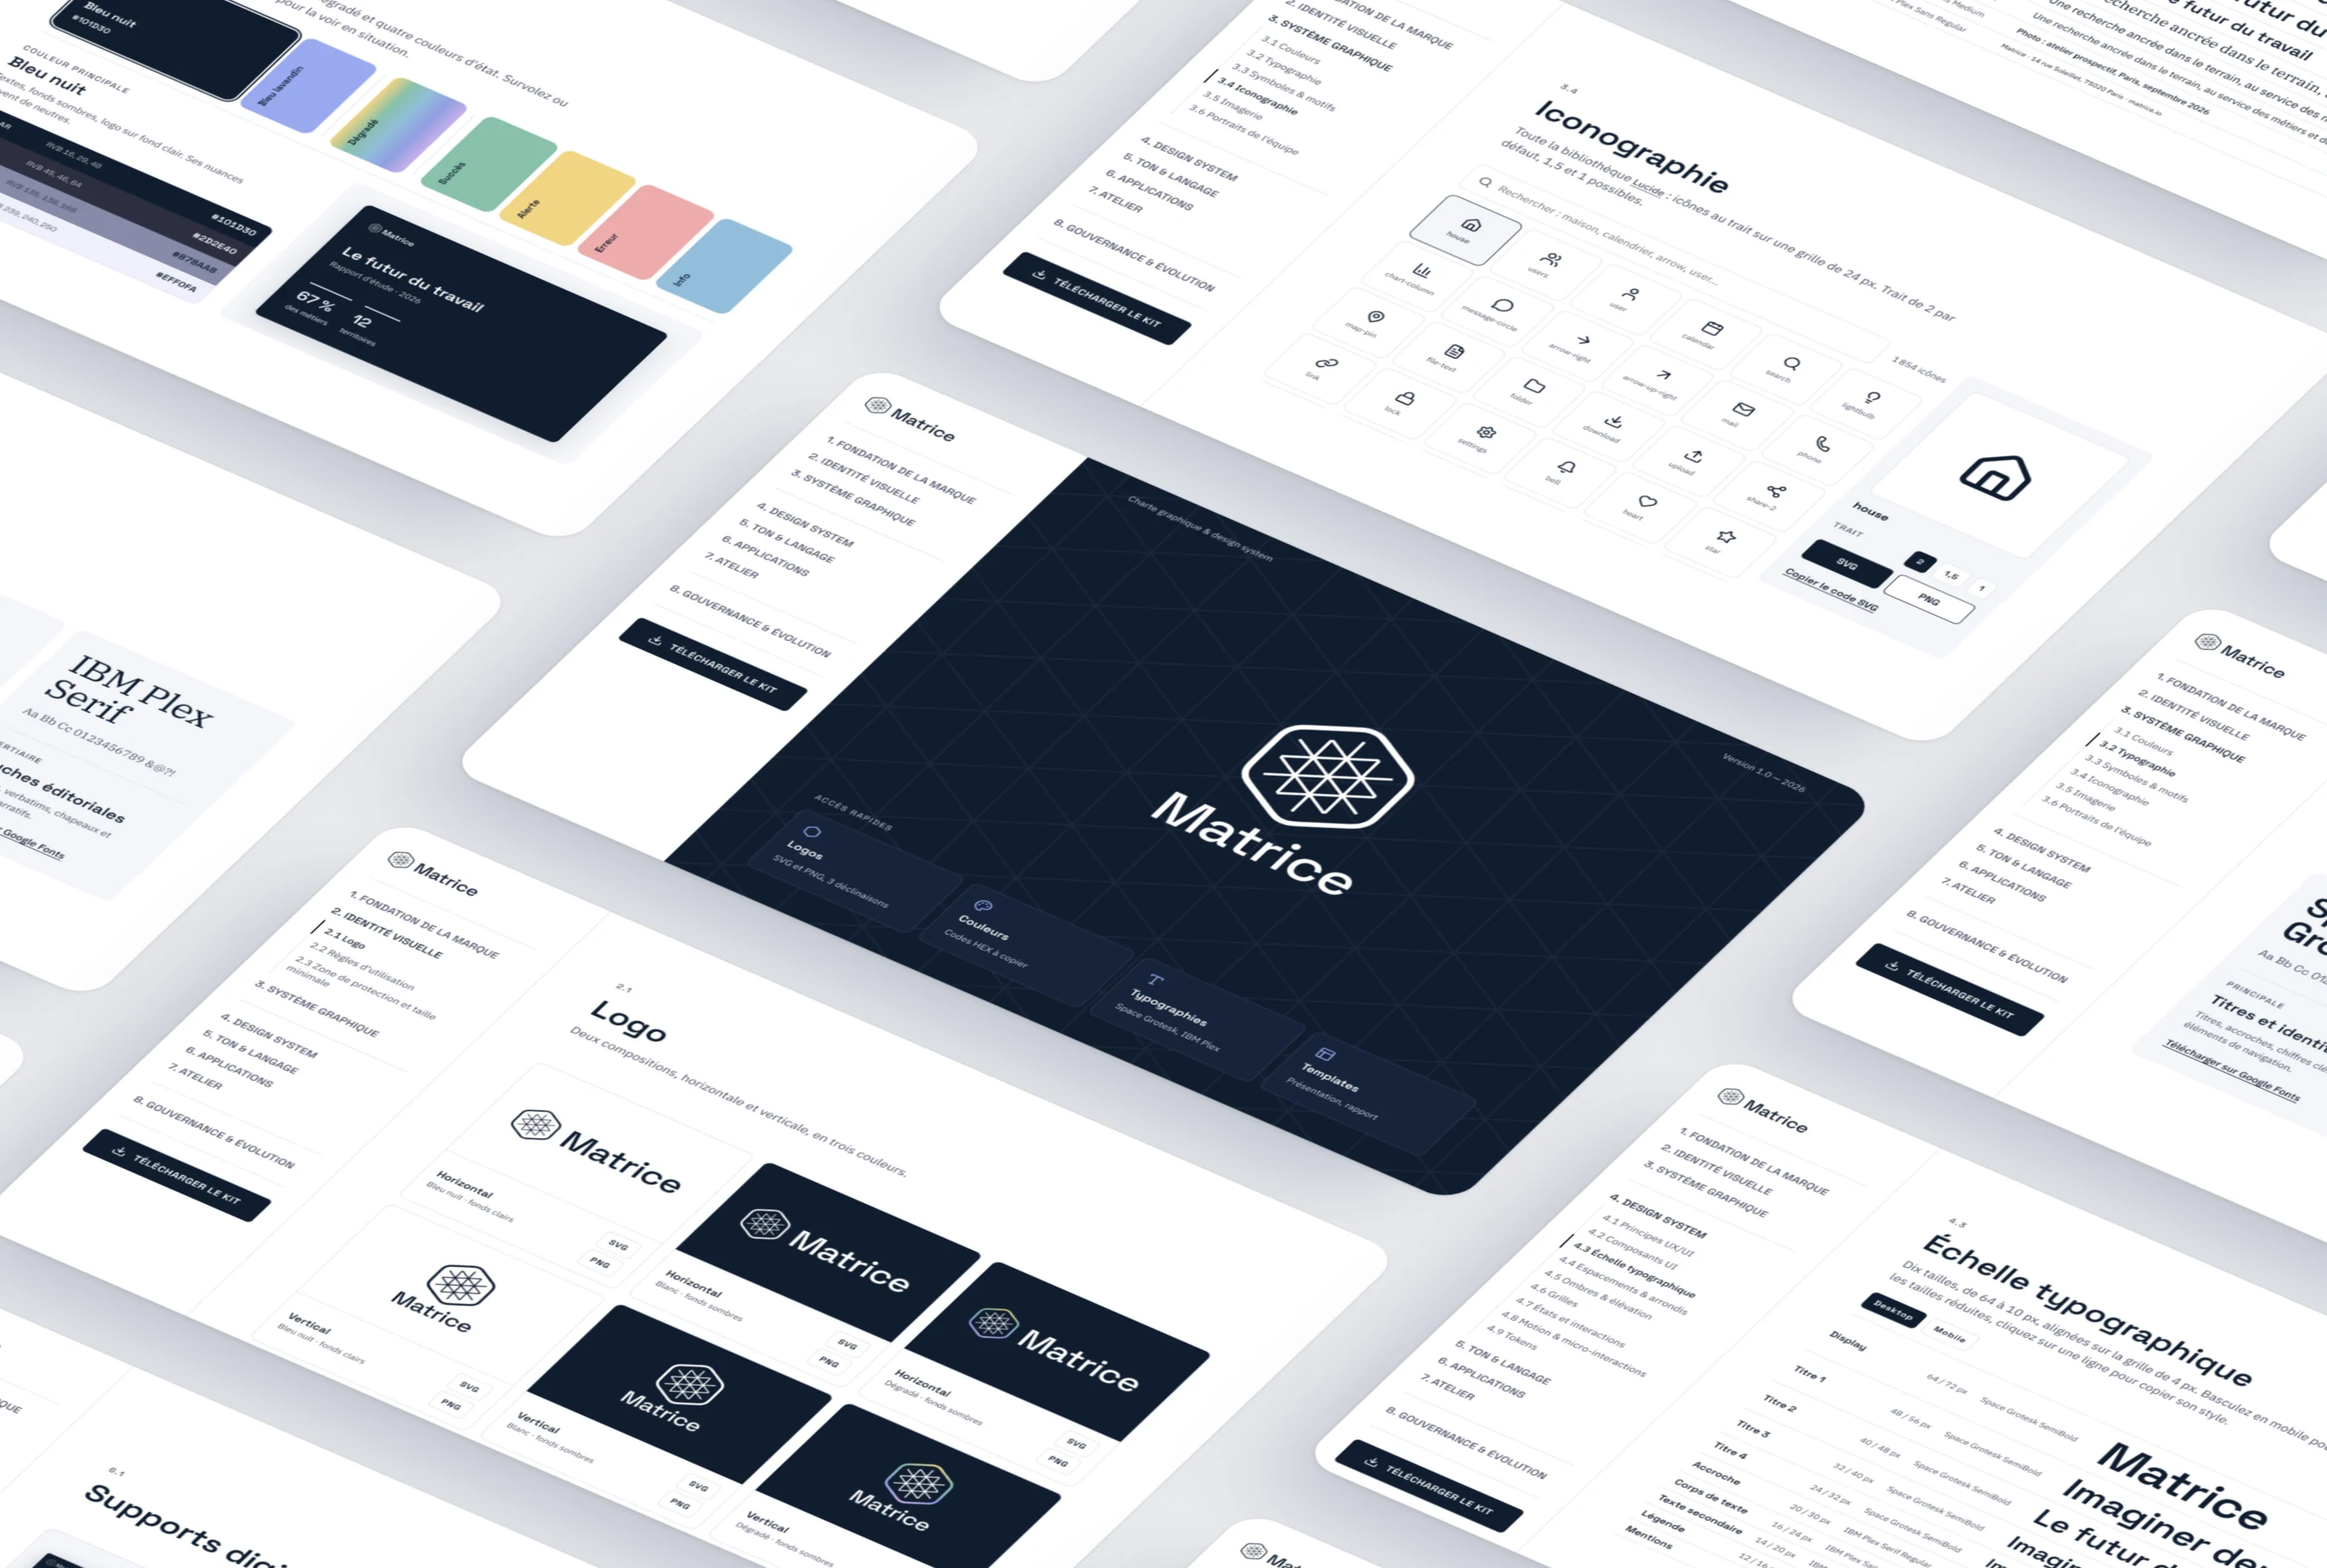
Carbon Calculator
Turning an Excel file only experts could use into a business app that measures and compares the carbon footprint of Enedis worksites.
- Client
- Enedis, internal tool
- Role
- UX/UI Designer
- Year
- 2024
- Deliverables
- Application, 4 dashboards
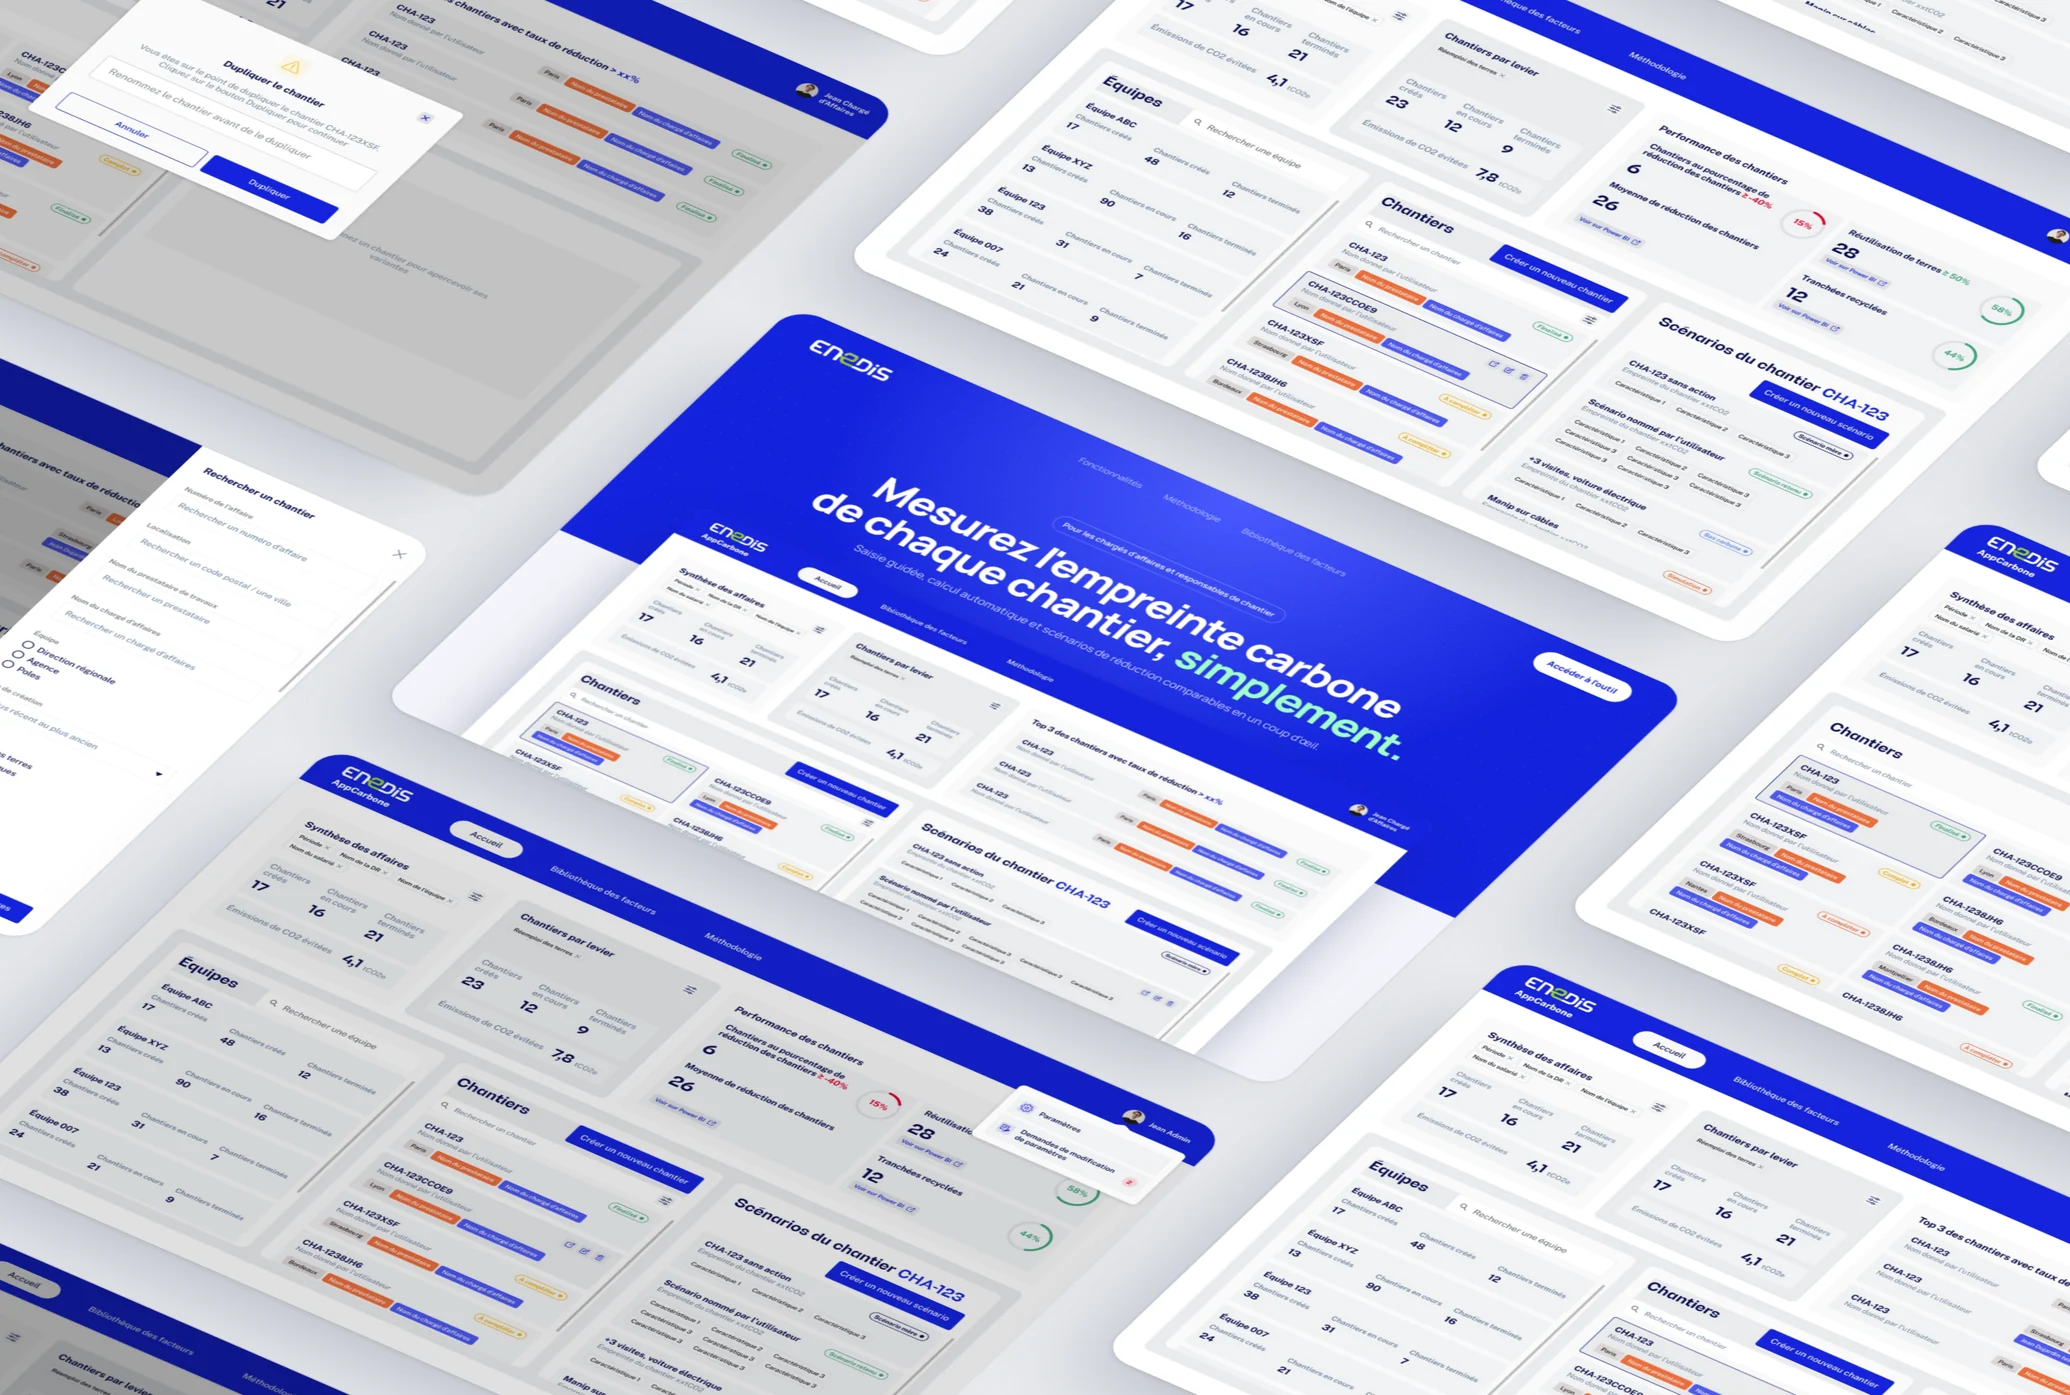
A tool that had become strategic, but was slow, hard to learn and impossible to roll out.
Enter the worksite once, then test scenarios that only carry the chosen reduction levers.
A four-role application where low-carbon scenarios are compared without duplicating a single file.
A strategic tool, stuck in a spreadsheet.
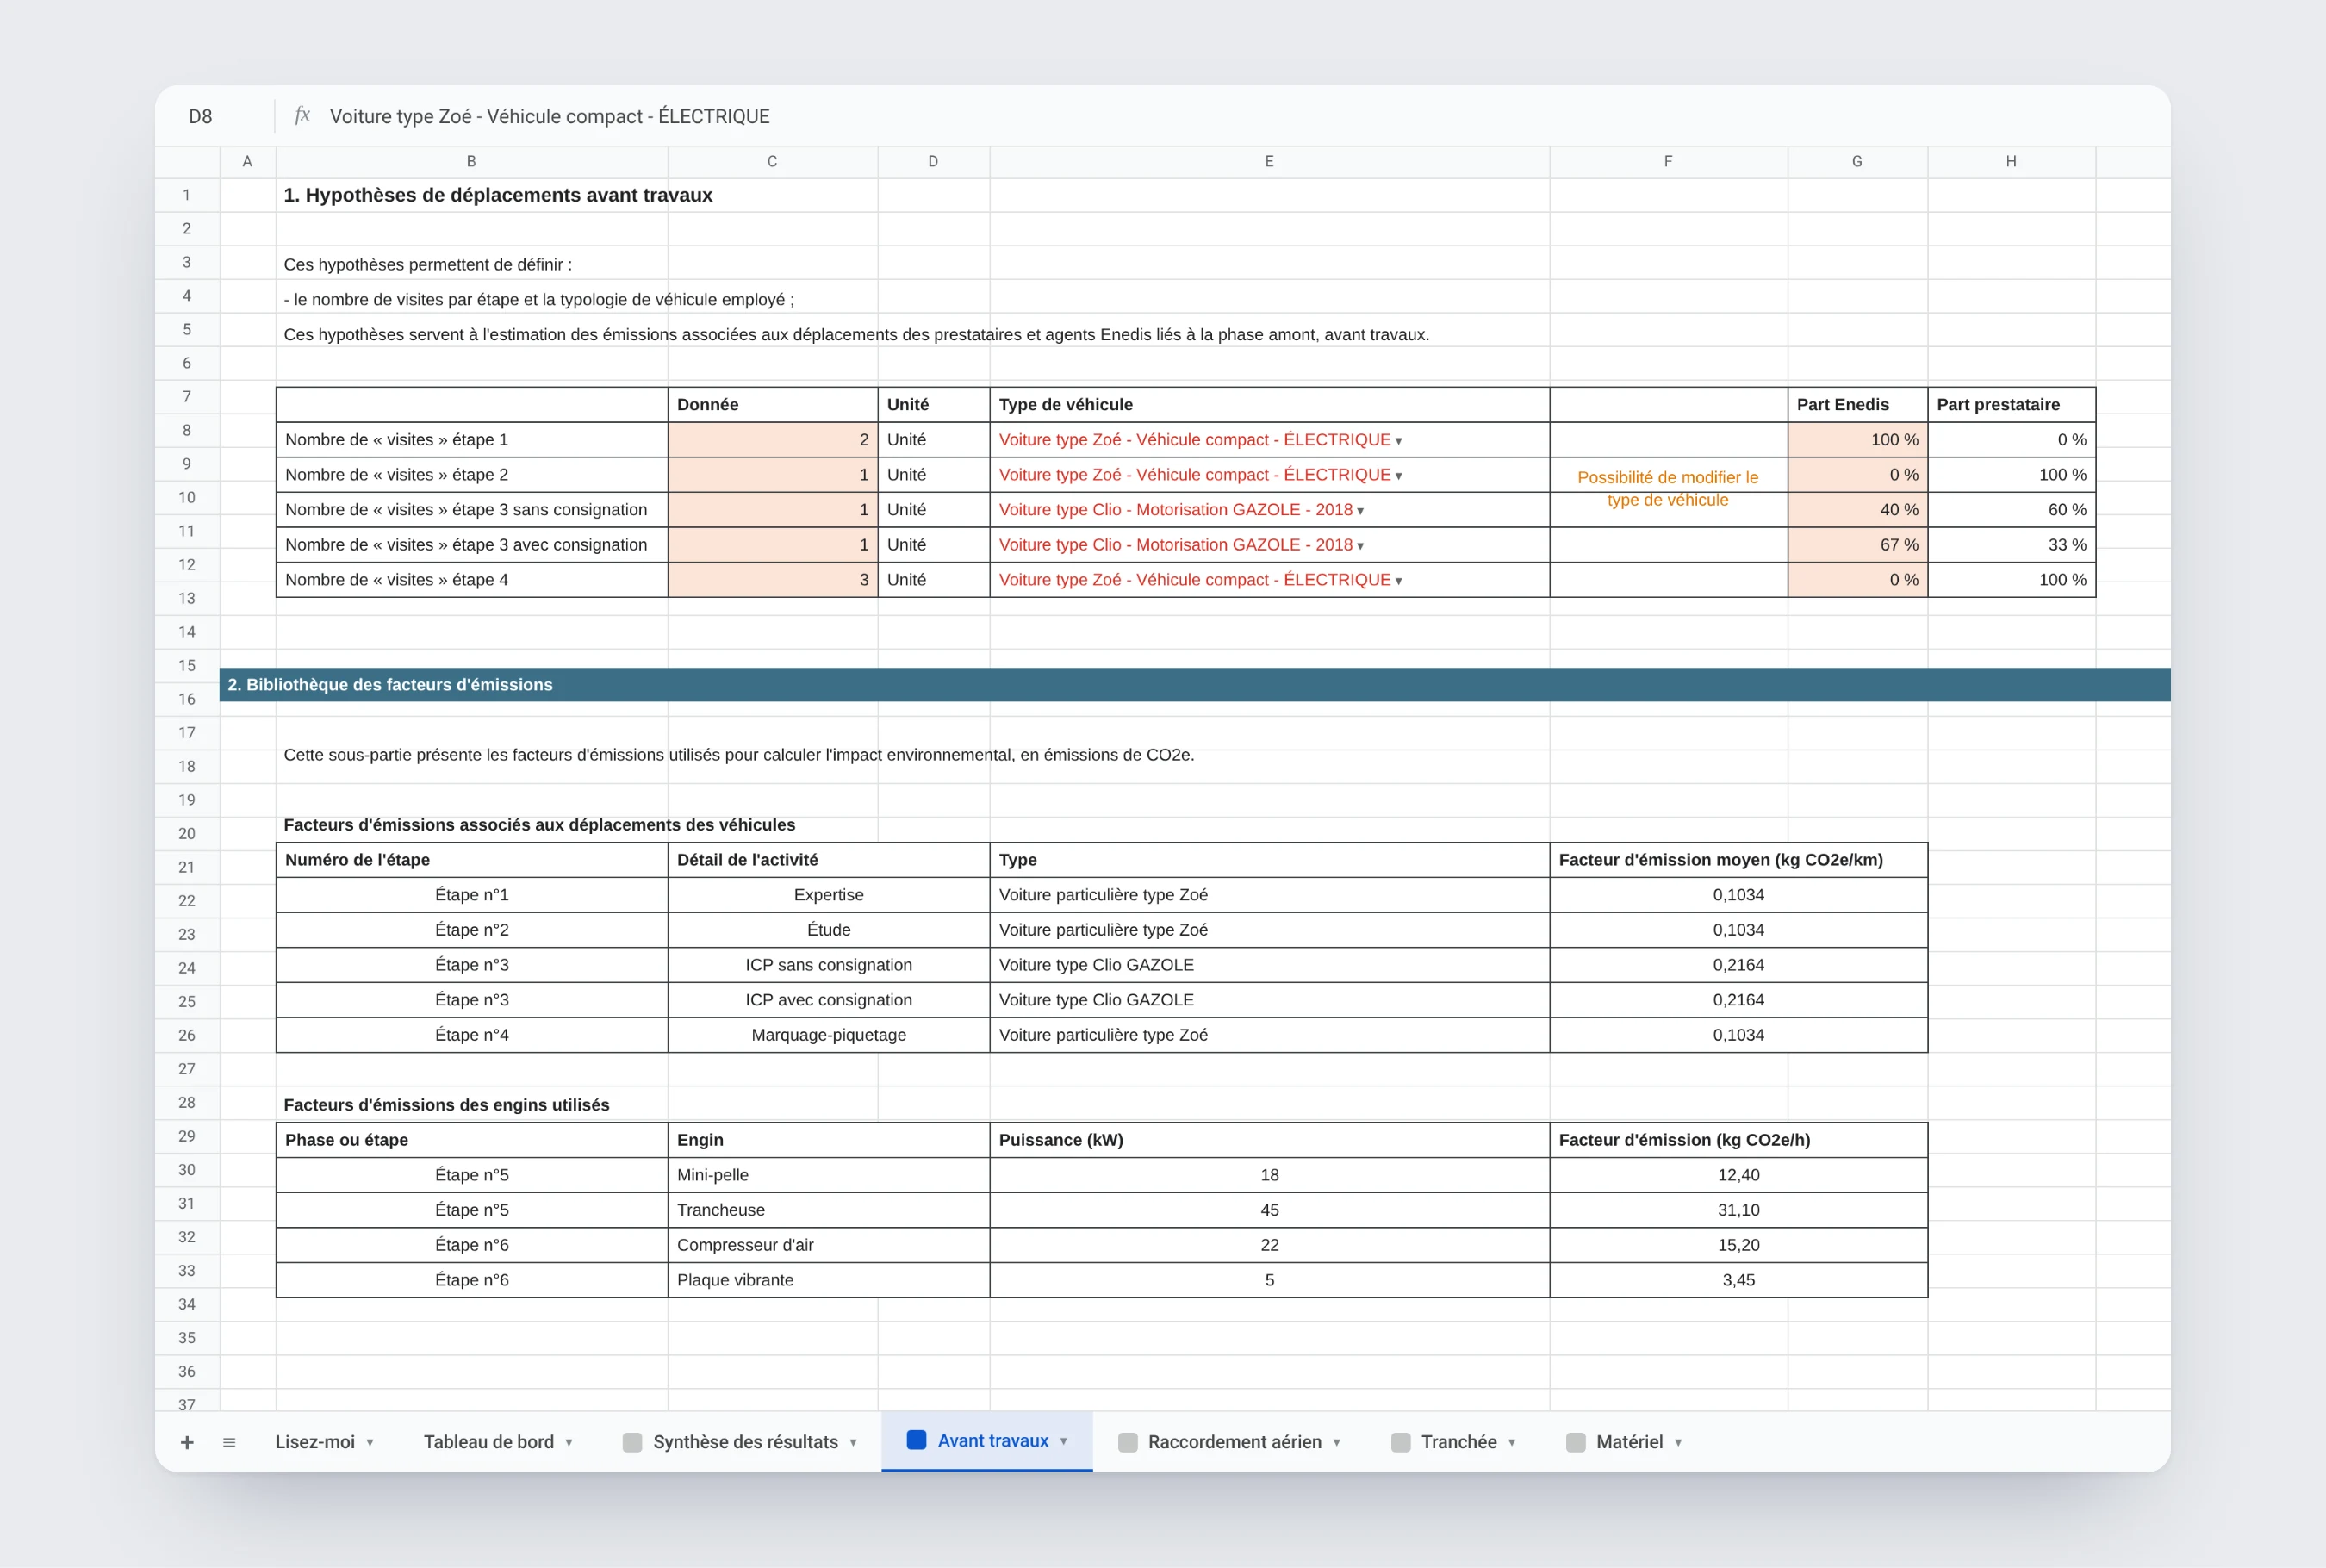
The Carbon Calculator measures the carbon footprint of Enedis grid connection worksites: trenches, cables, machinery, concrete, travel. Built as an Excel file, it became critical as environmental stakes rose, without being reliable or accessible.
Slow, opaque, impossible to roll out.
One file to duplicate per scenario
Testing a low-carbon variant meant copying the file and re-entering everything.
Comparisons done by hand
No view put two scenarios side by side.
Technical tabs to dig through
One tab per connection type, which only experts knew how to fill in.
Hard-to-read results
Tables of numbers, with no hint of where to act first.
Four jobs, four dashboards.
Every user lands directly on the interface for their role. Same structure, different priorities.
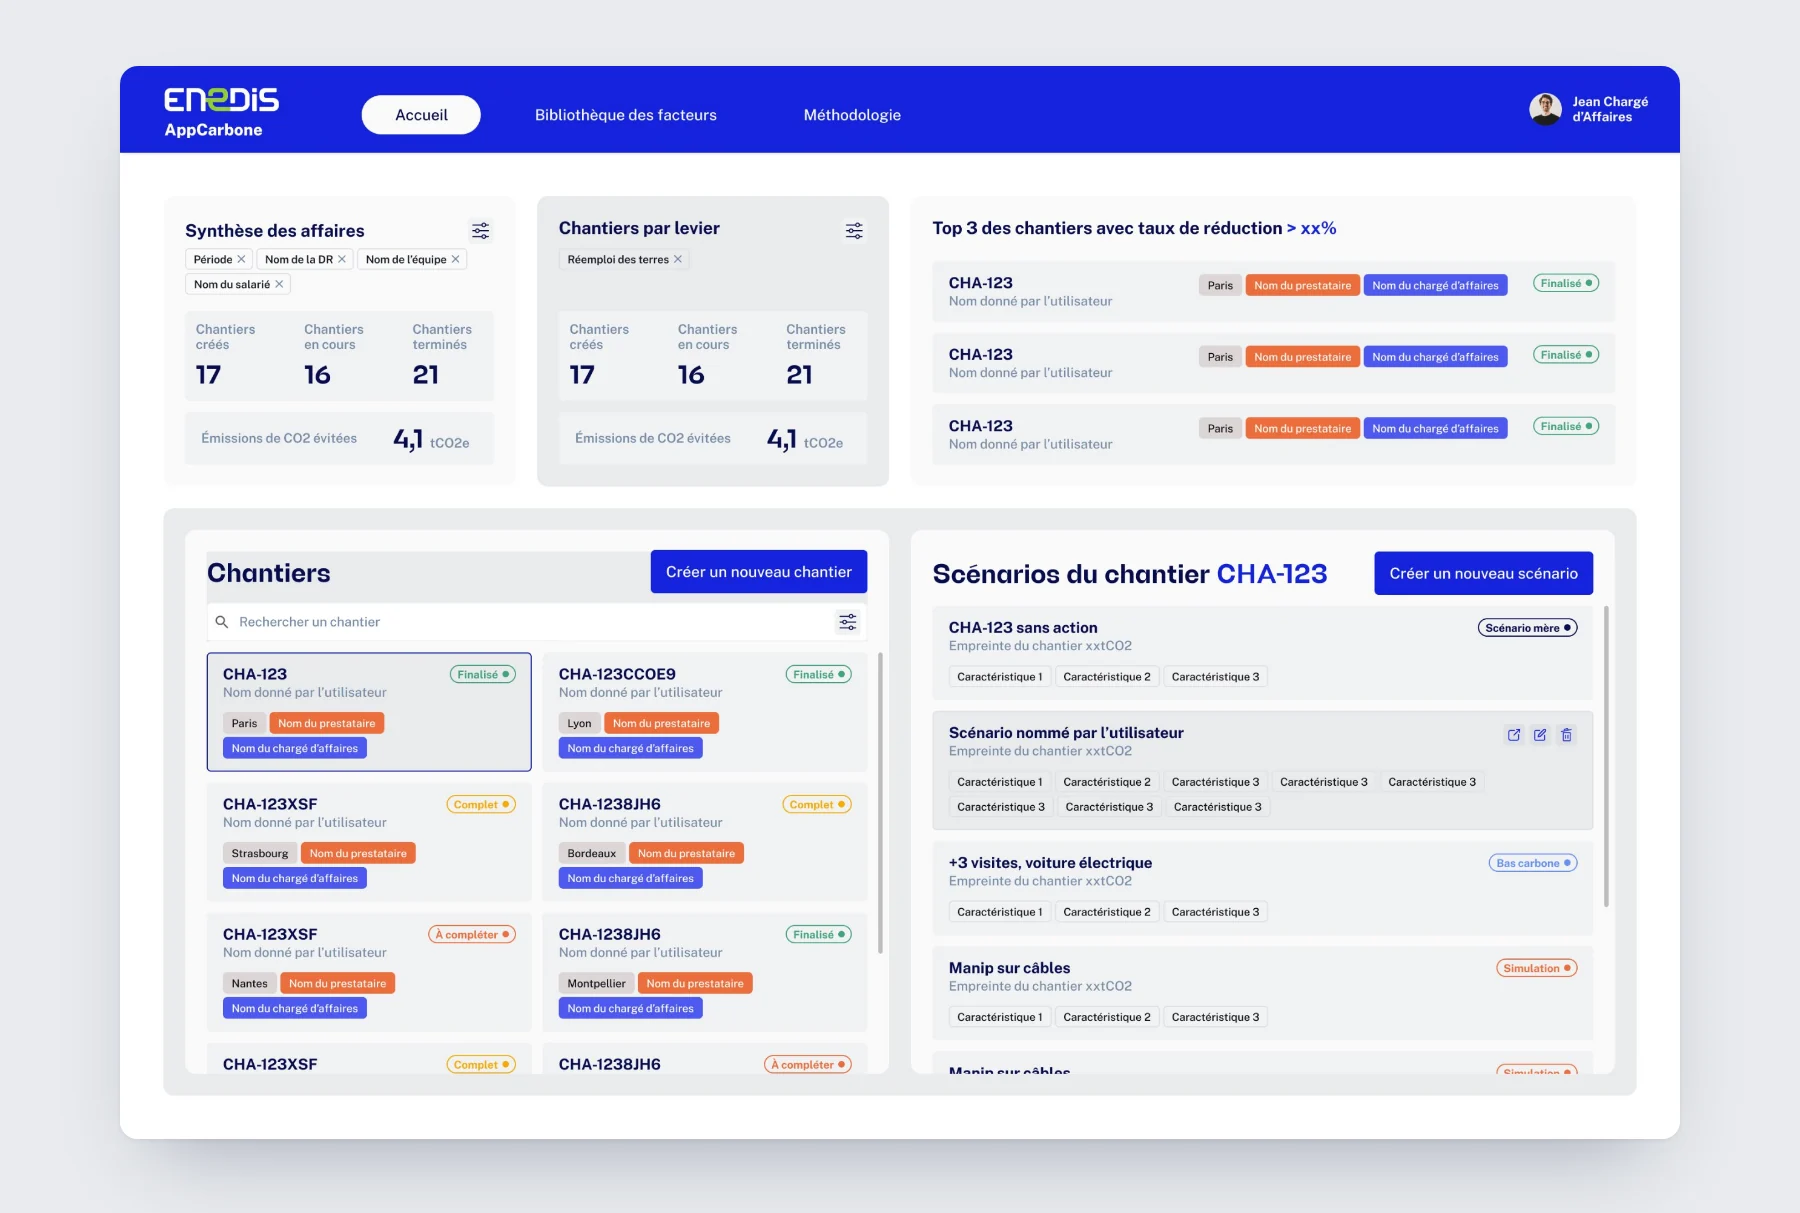
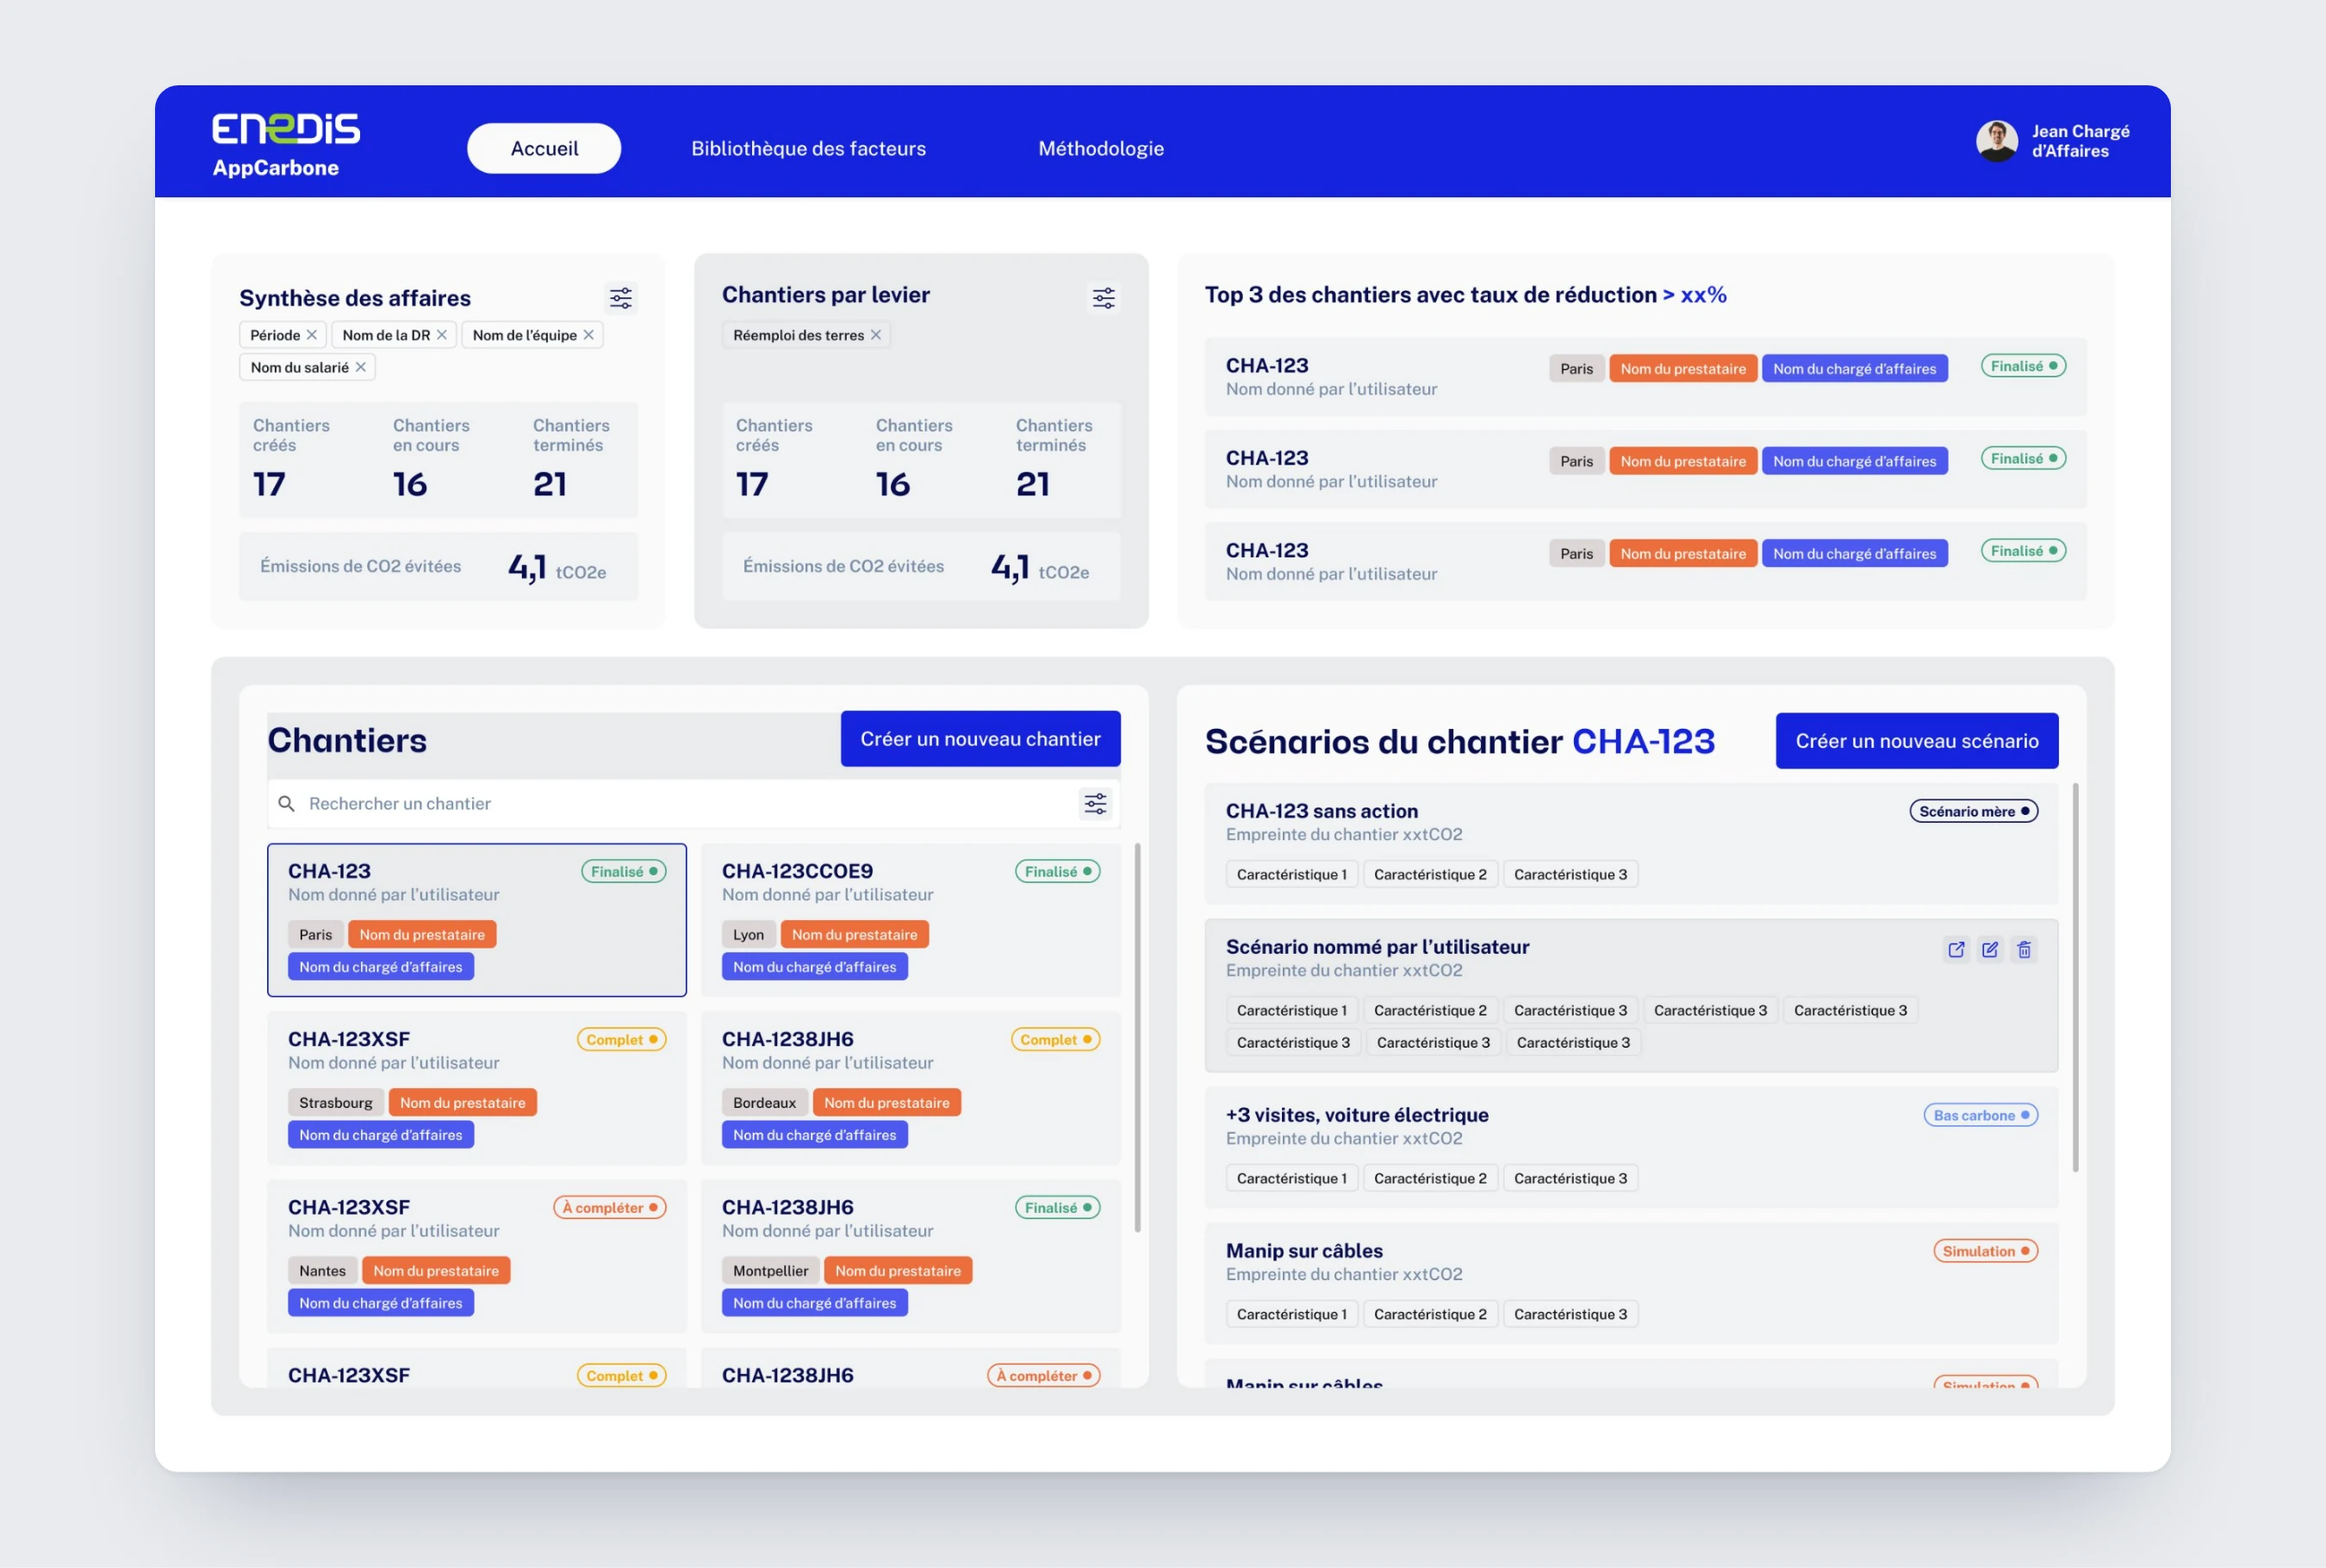
Their dashboard shows their worksites with their status (finalized, complete, to complete) and the scenarios of the selected worksite.
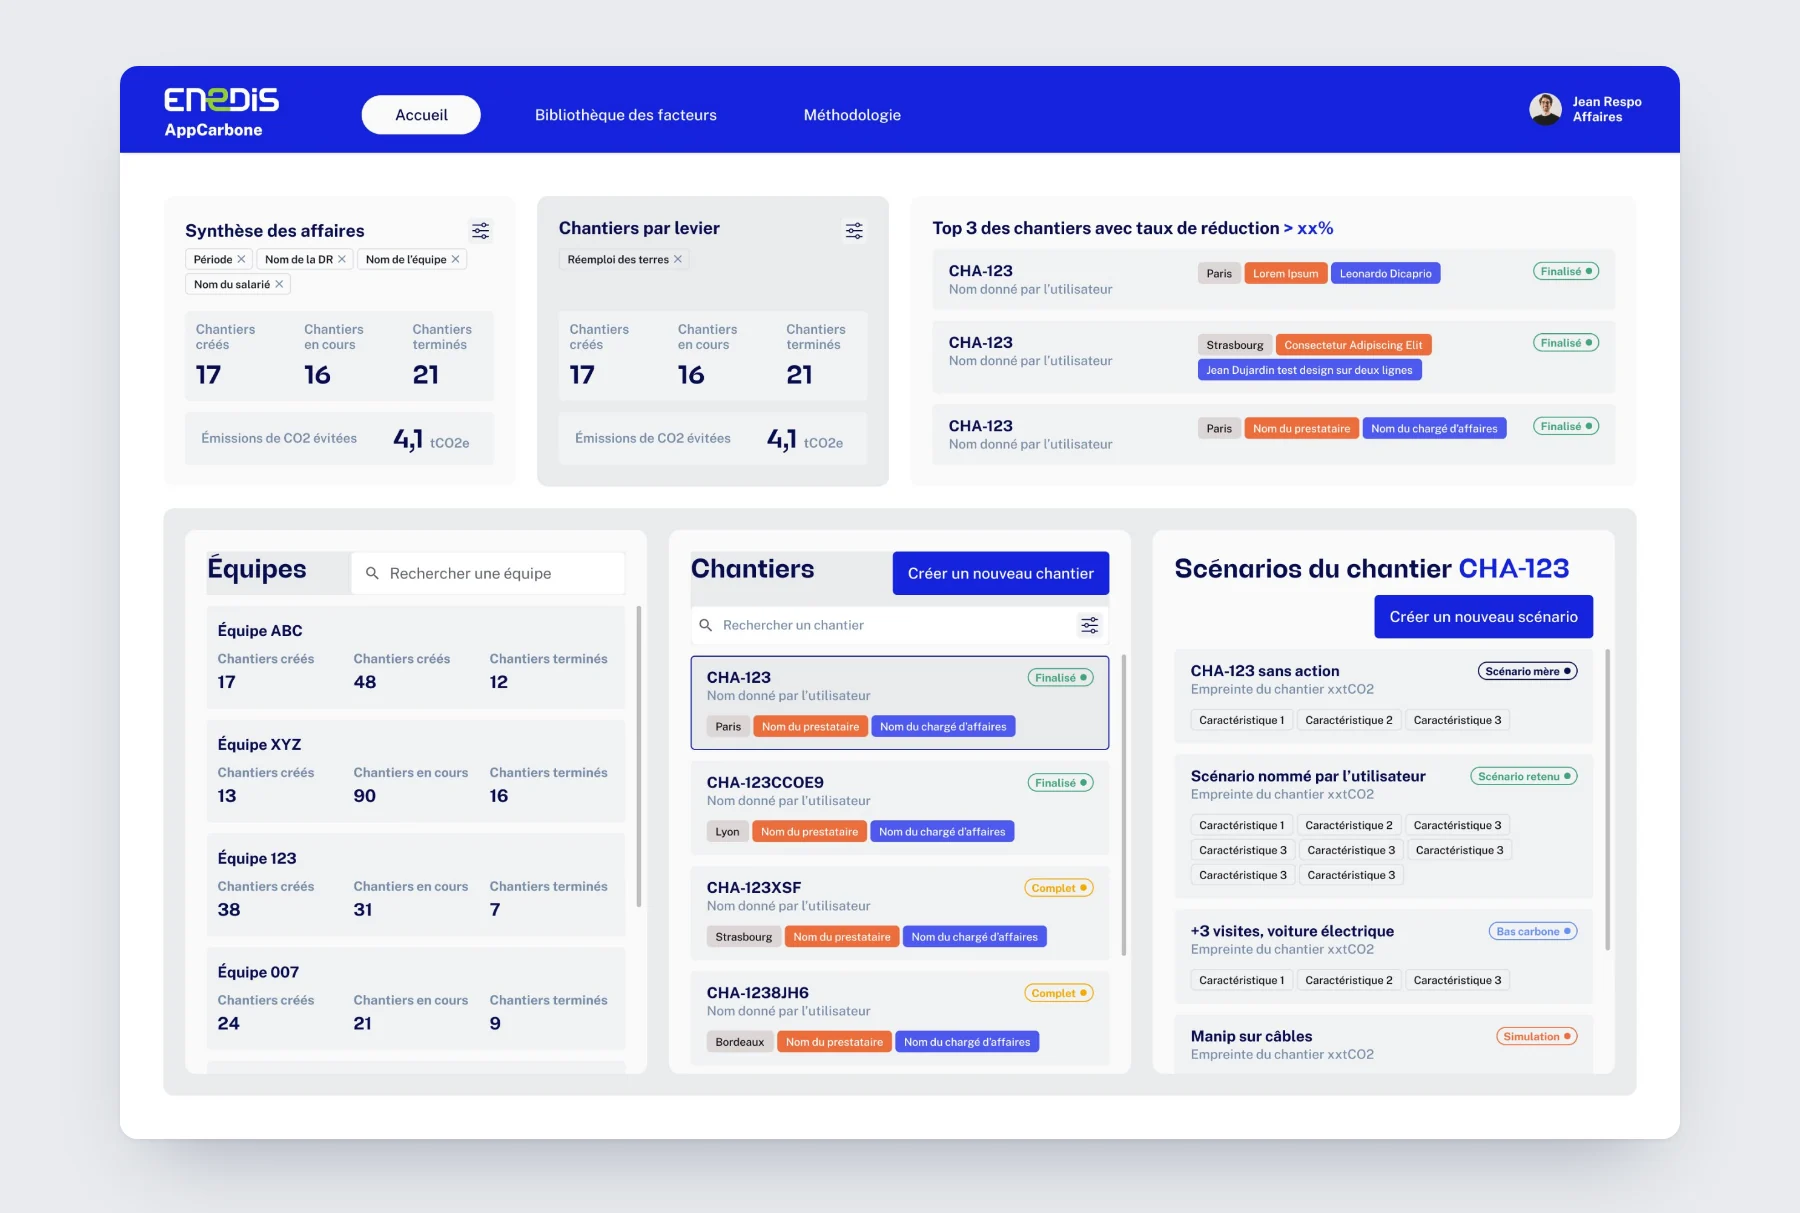
Their dashboard shows worksites grouped by team, then by project manager.
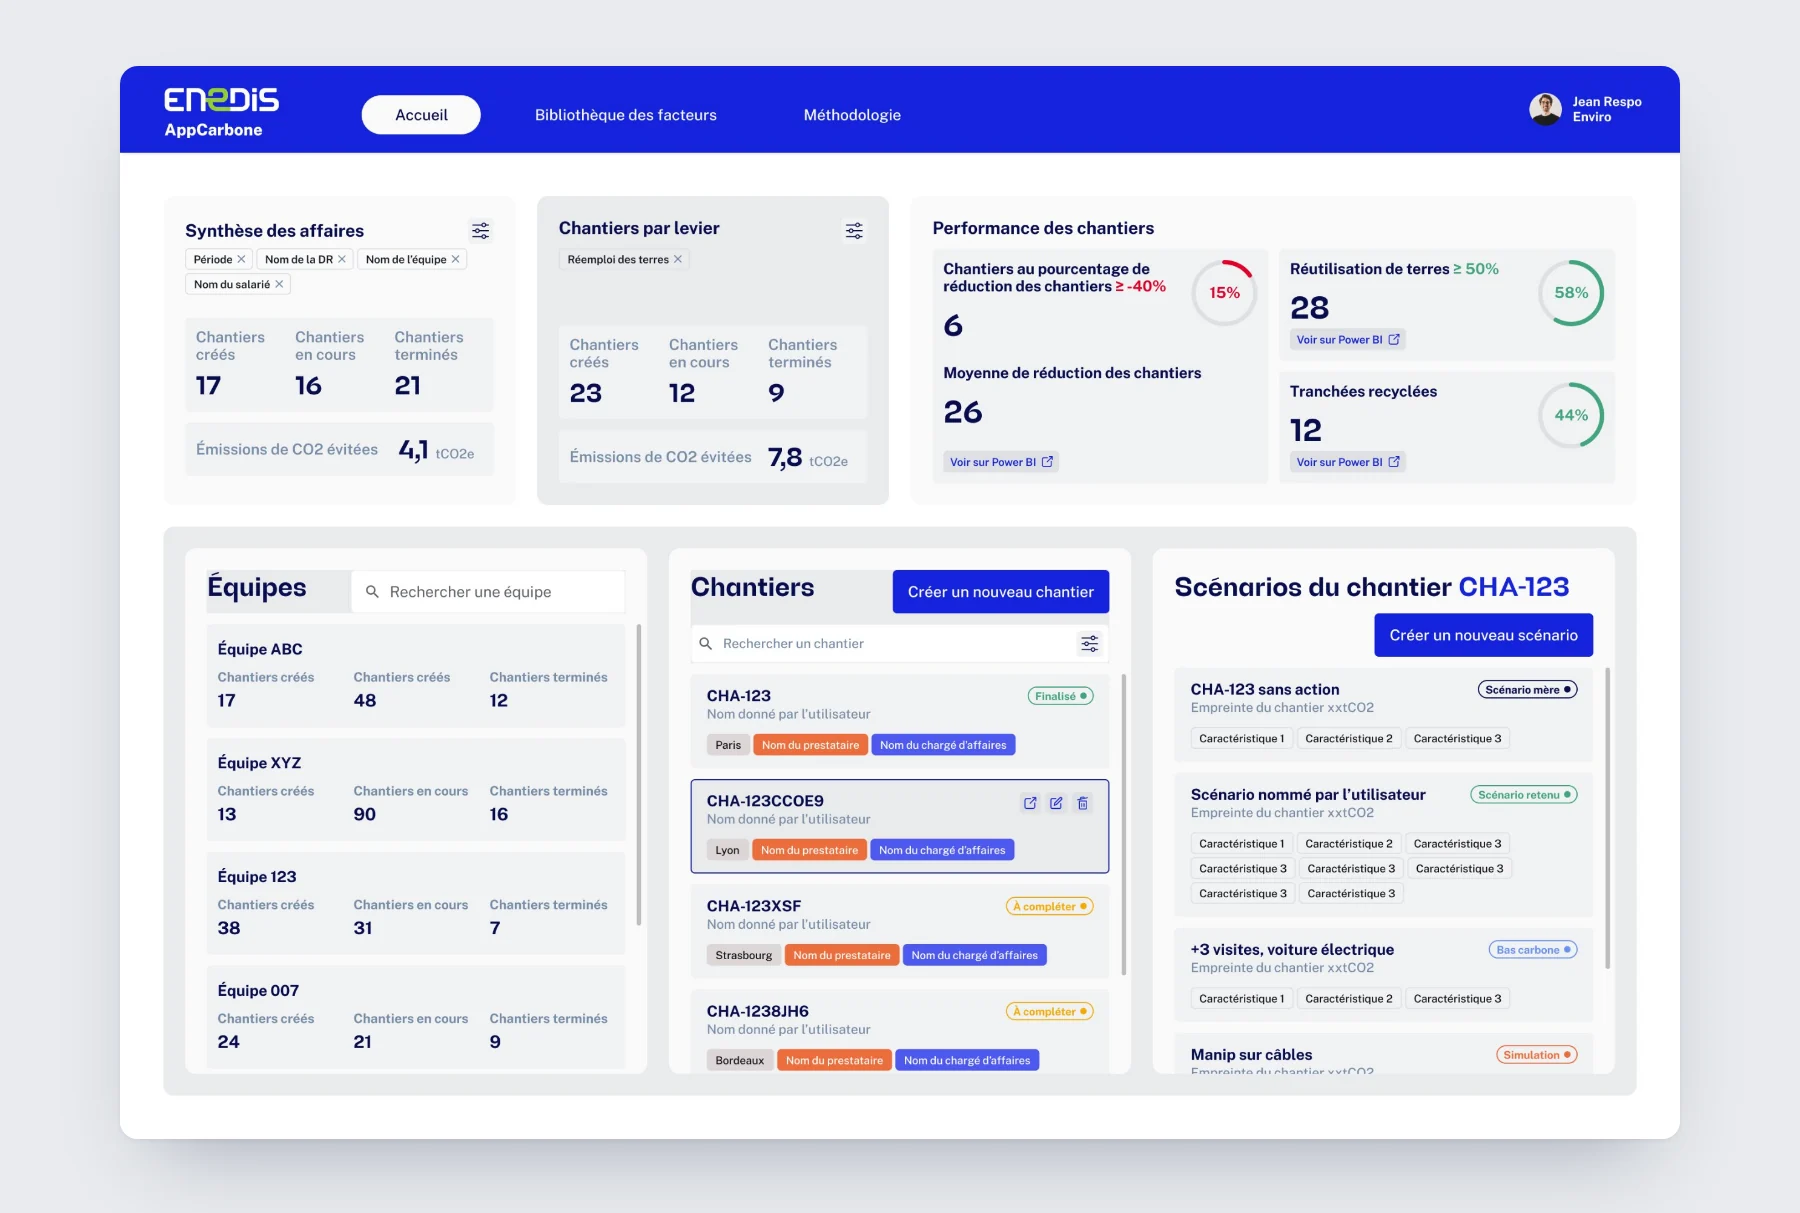
Their dashboard shows the worksites' reduction rate, soil reuse and recycled trenches.
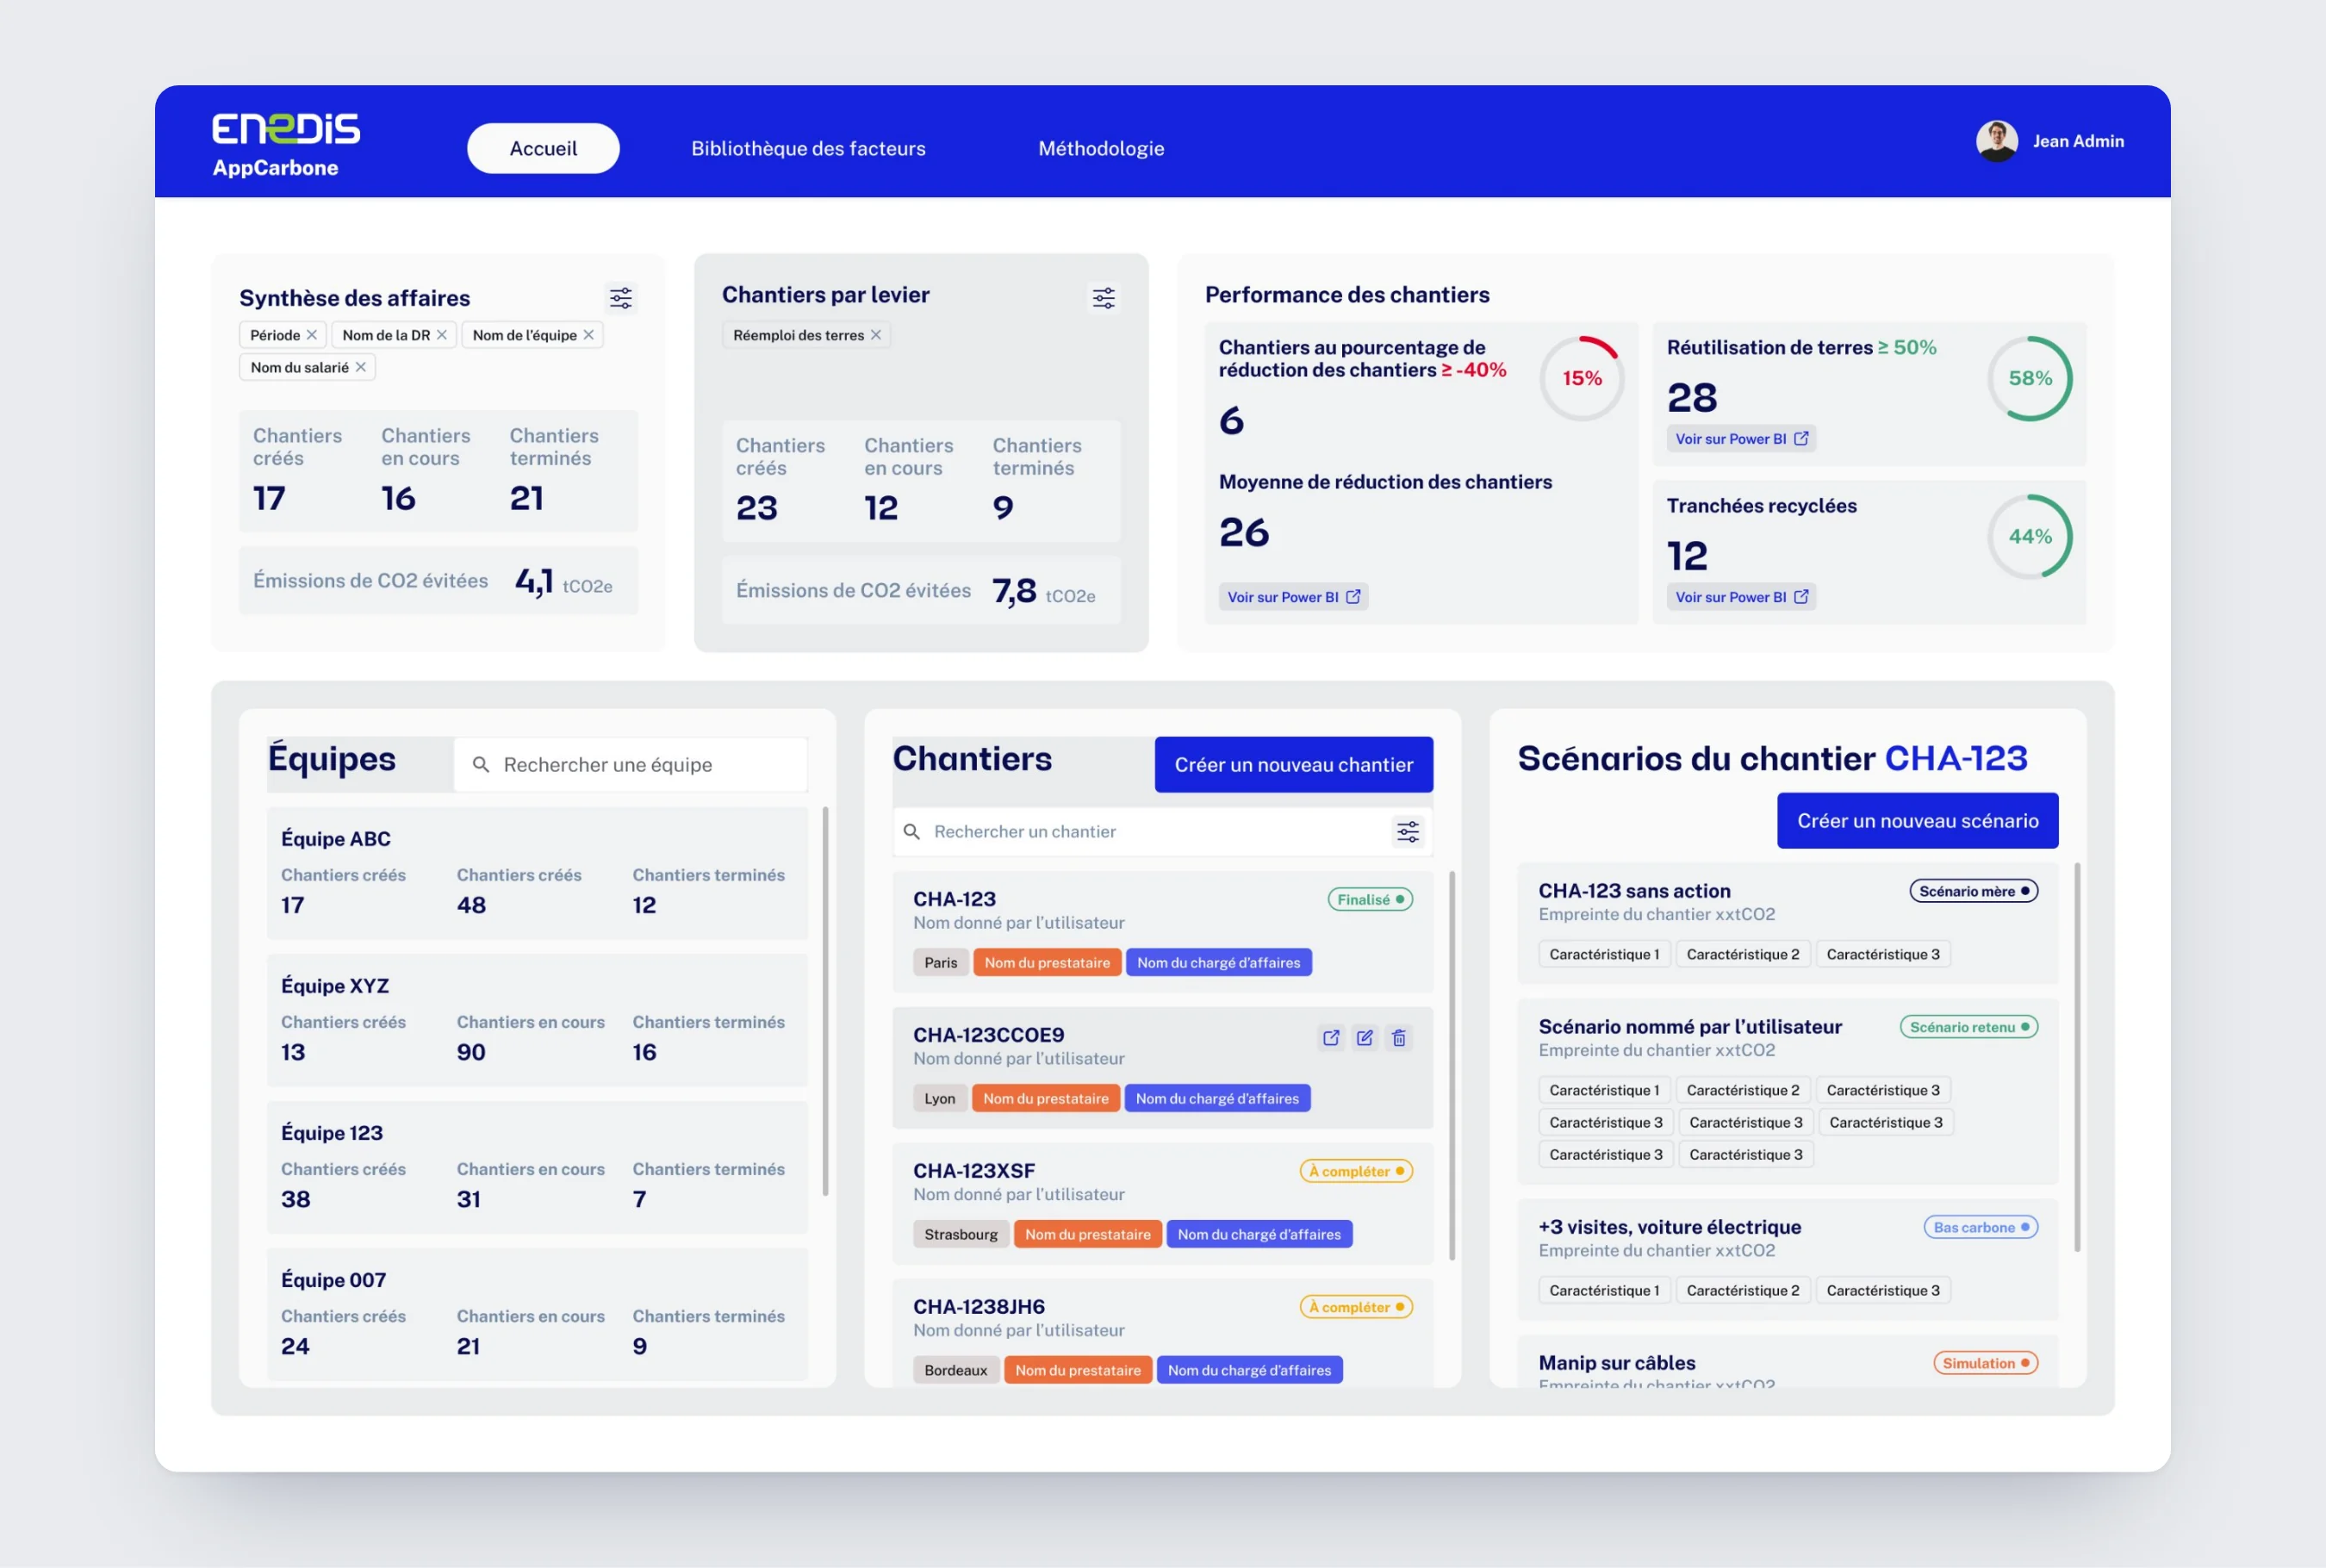
Their dashboard shows every view combined: business summary, worksite performance, teams, worksites and scenarios.
Where each Excel tab went.
Rather than transposing the spreadsheet screen by screen, I placed each piece of content where it's actually used.
- One file per scenarioScenarios attached to a worksite
- One tab per connection typeSections added on demand
- The explanations tabTooltips on every field
- The factor tablesA factor library, reachable from every block
- The summary tabRole-based dashboards
- Project and scenario data mixed togetherA worksite entered once, scenarios carrying only the levers
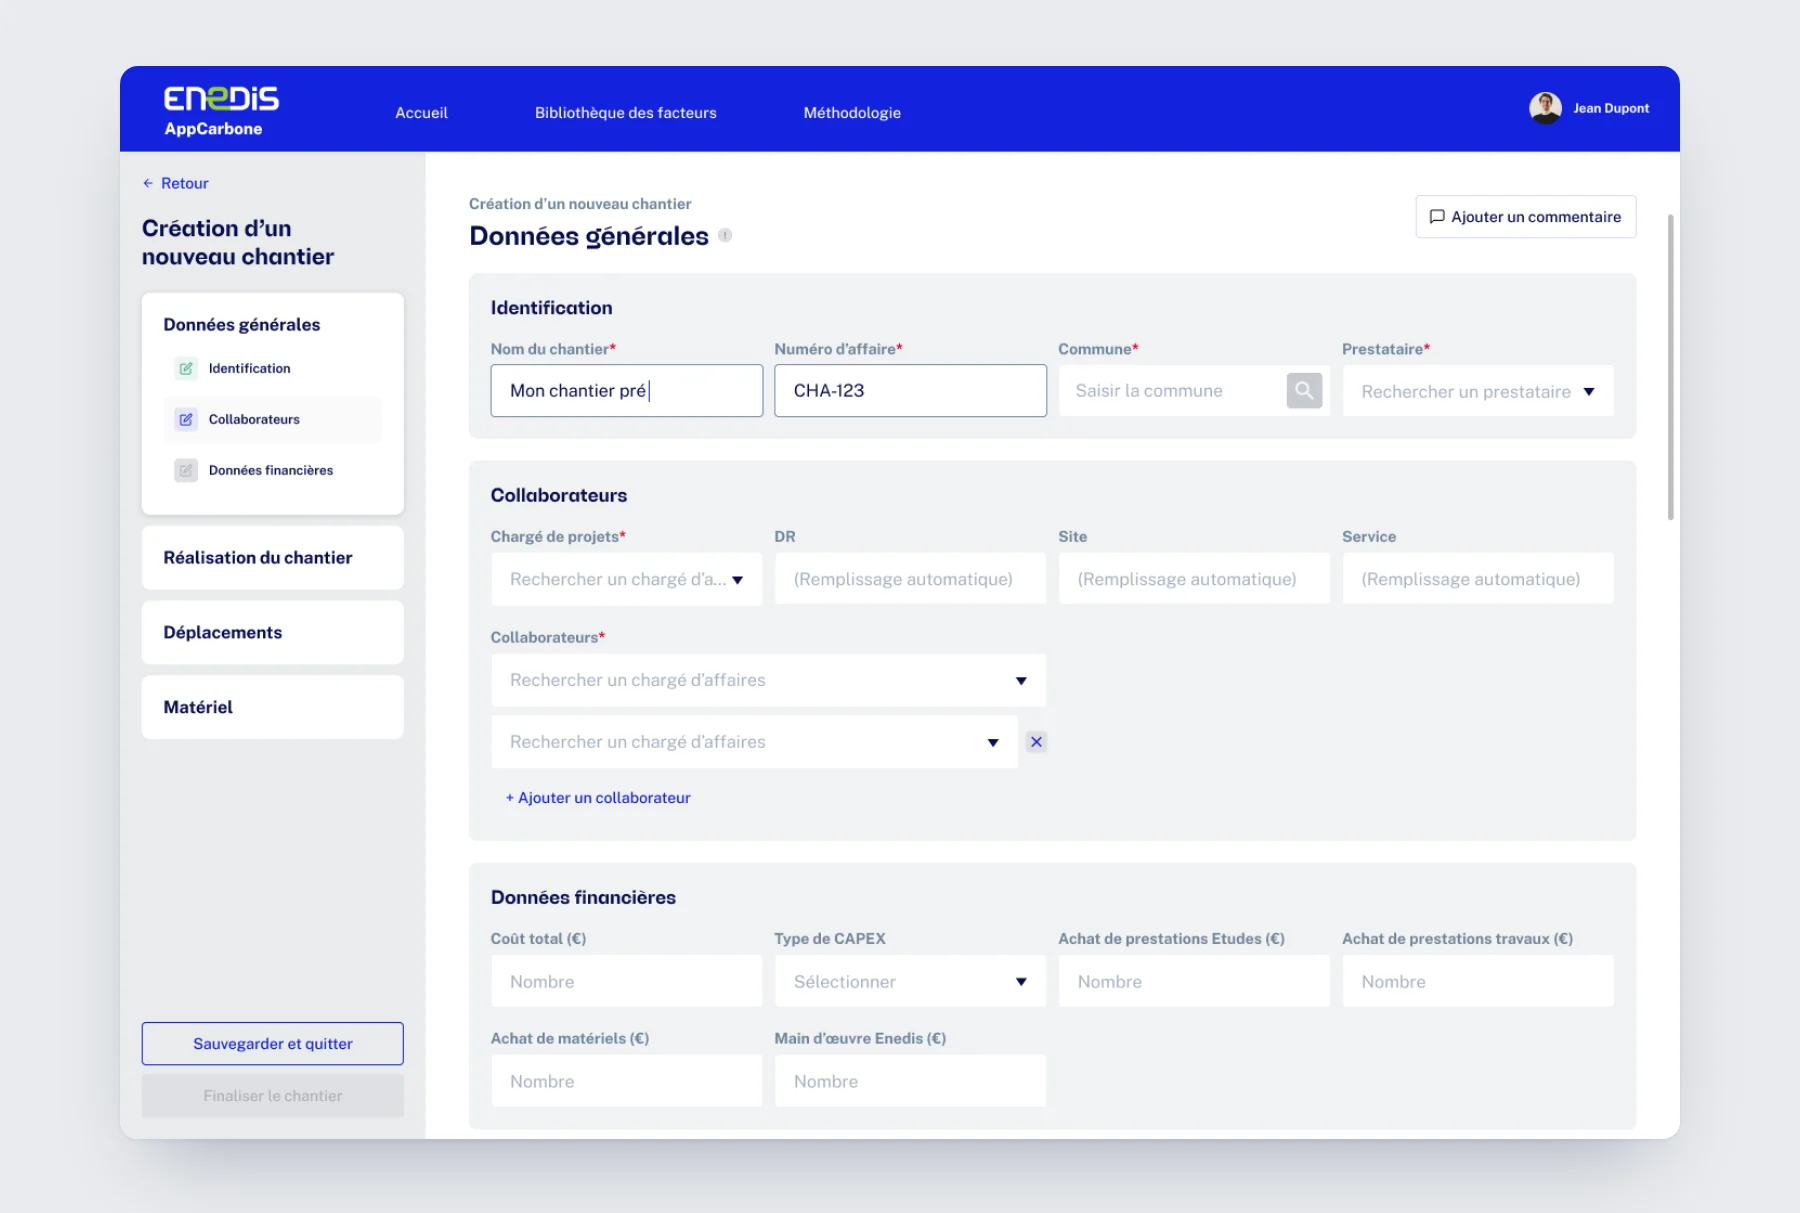
Describing the worksite in 4 steps.
- Project manager
- Identifies the worksite, its team and its financial data.
- Design choice
- Three short blocks. The regional division, site and department fill in automatically once the project lead is chosen.
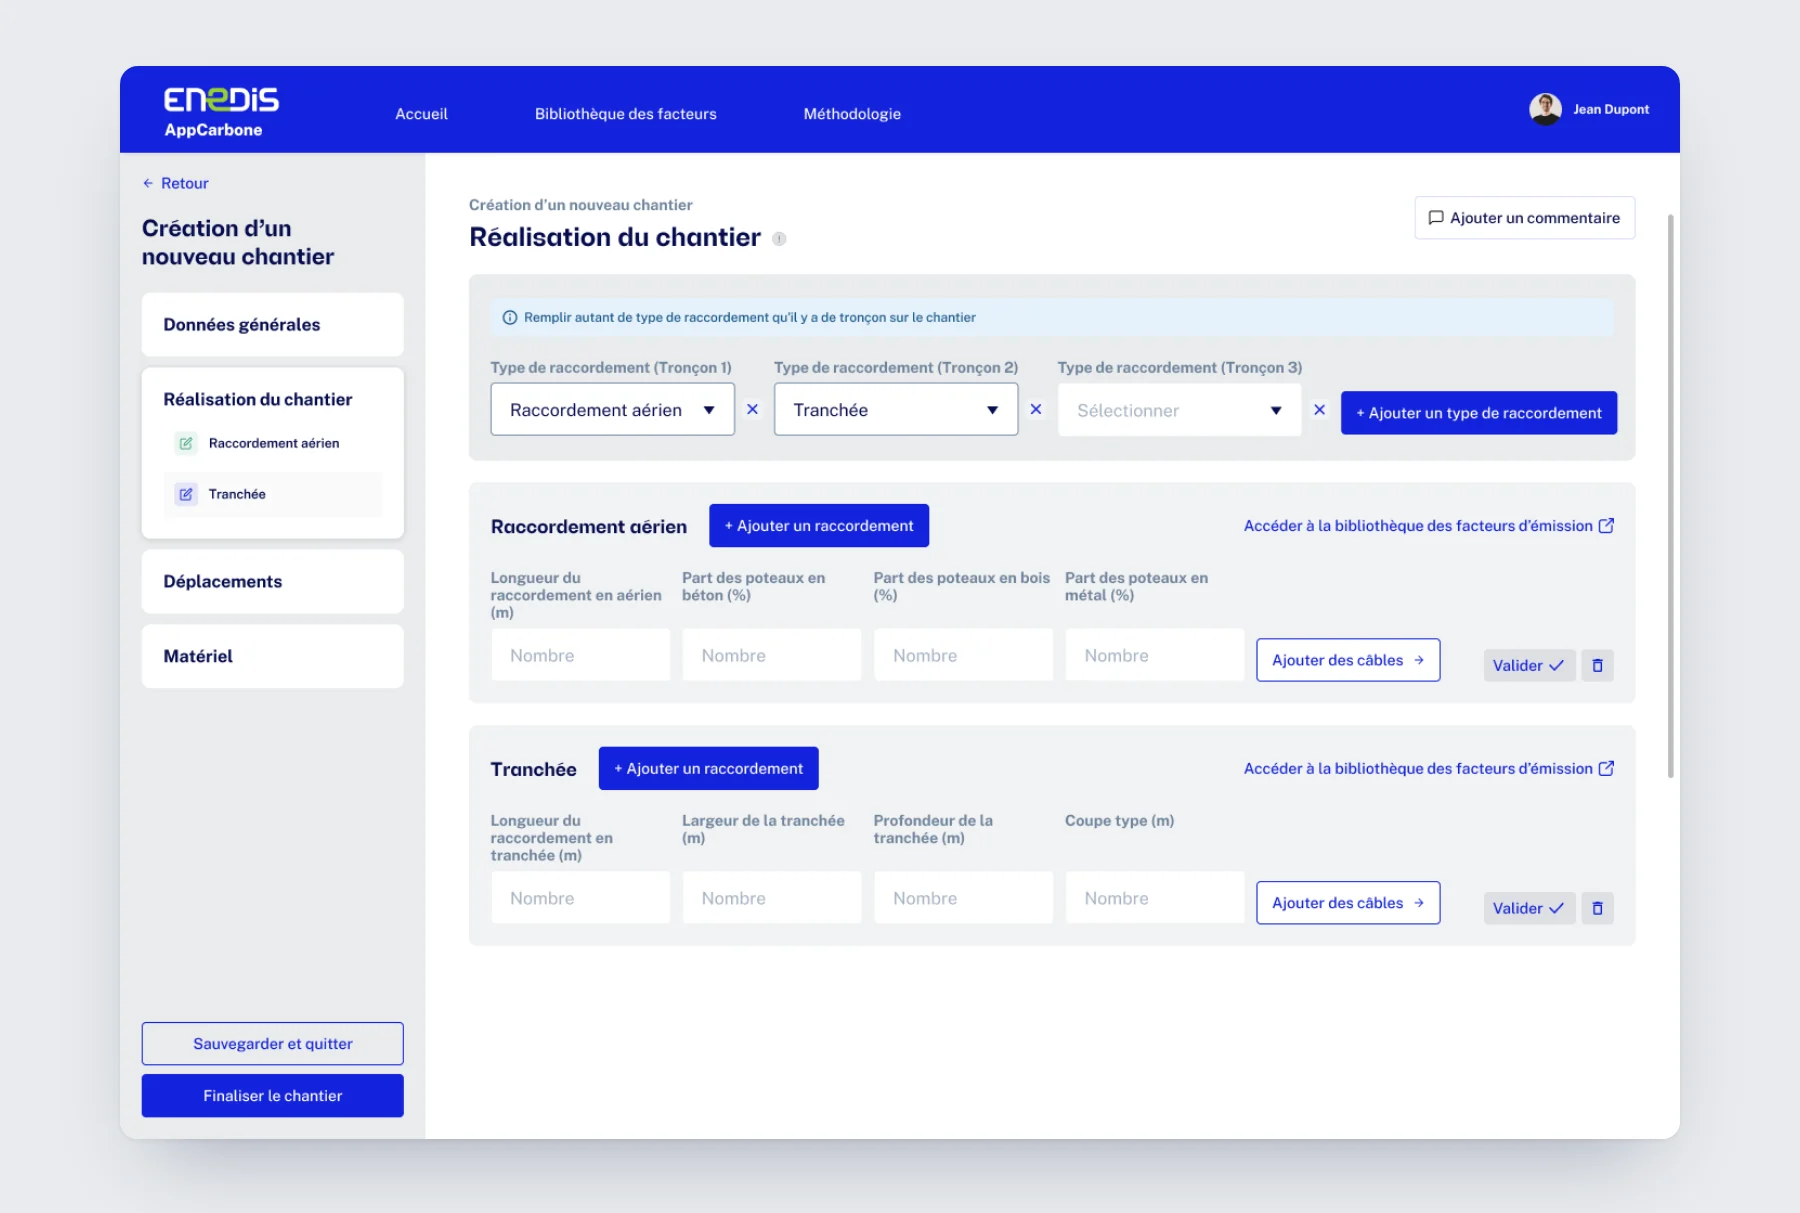
- Project manager
- Declares each section: overhead, trench, boring, duct reuse or tunnel routing.
- Design choice
- Each type added creates its own input block and menu entry. The form follows the reality of the worksite.
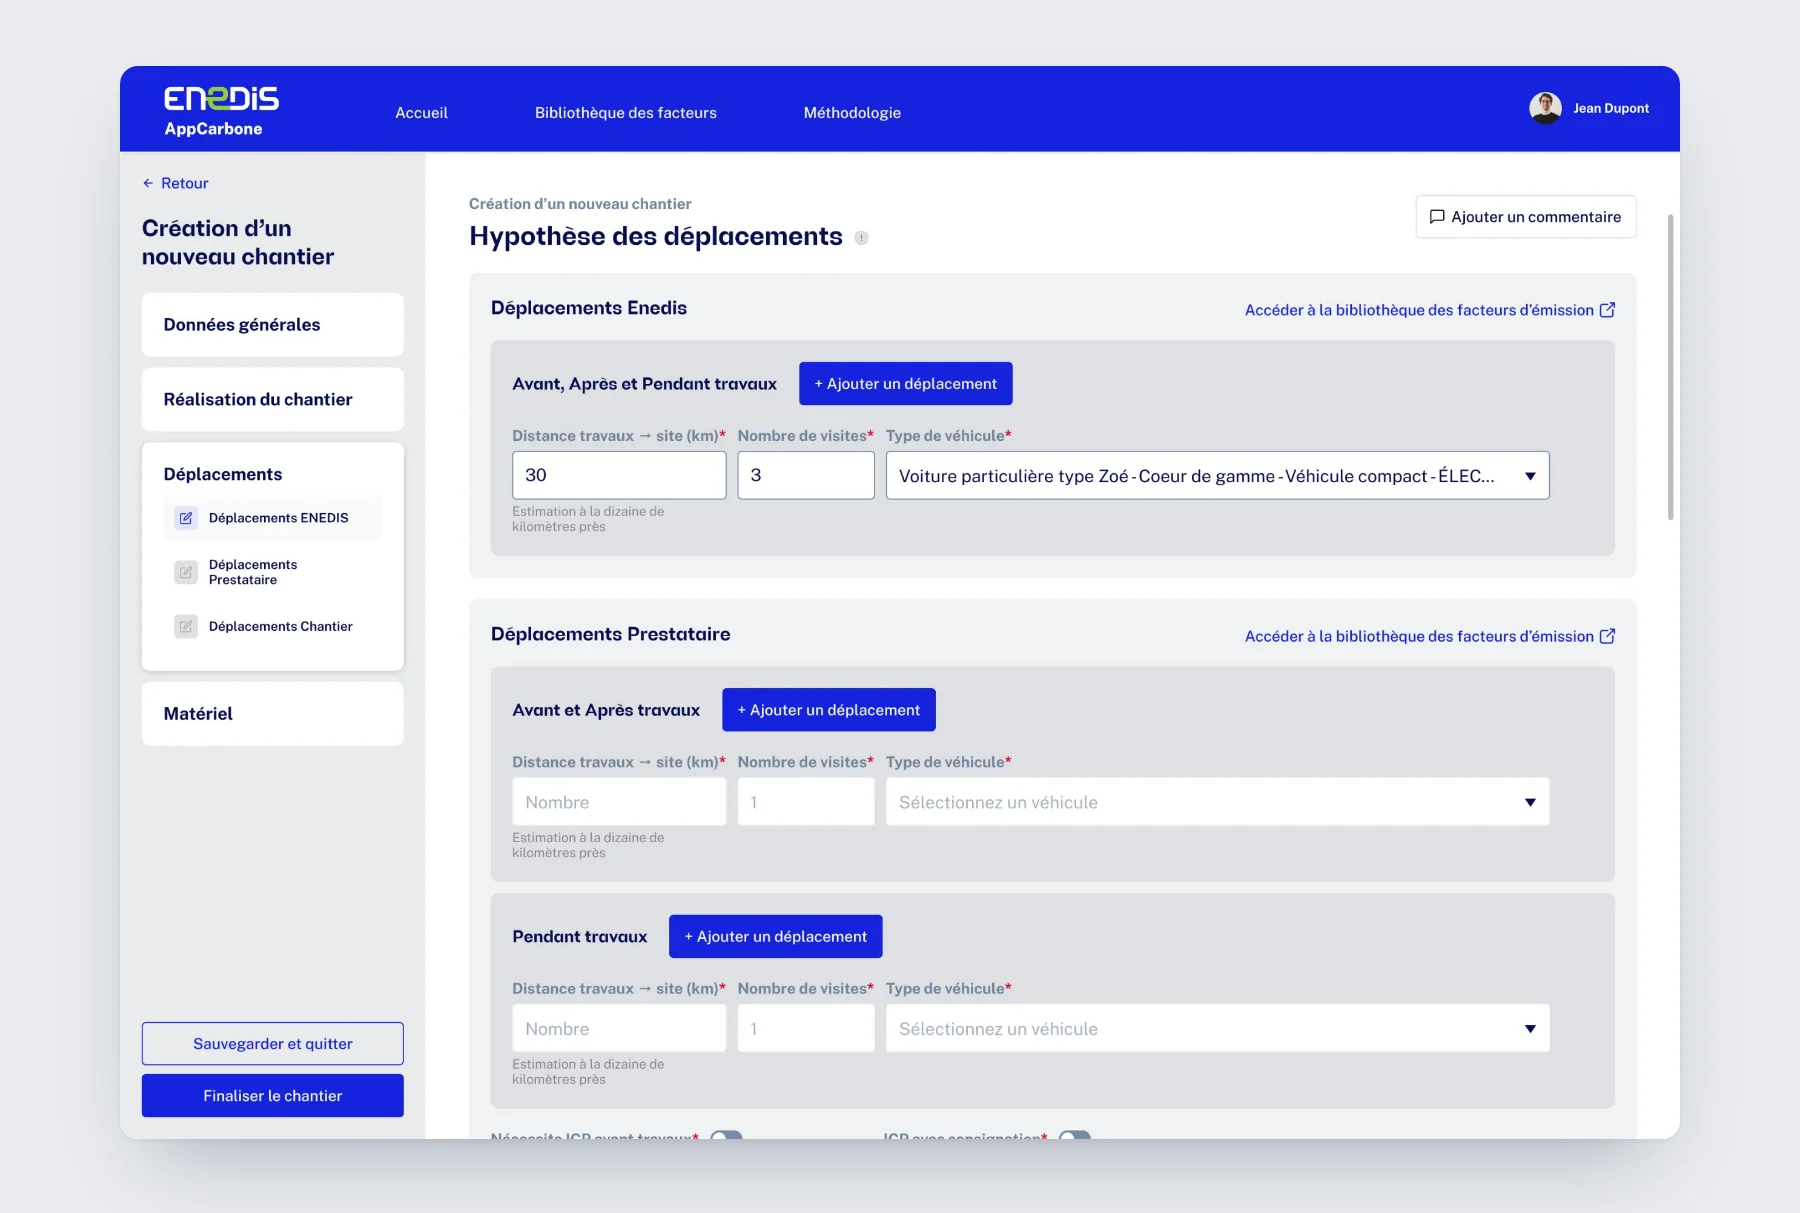
- Project manager
- Enters Enedis, contractor and worksite trips, before, during and after the works.
- Design choice
- Three fields per trip: distance, visits, vehicle. A tooltip explains what is calculated.
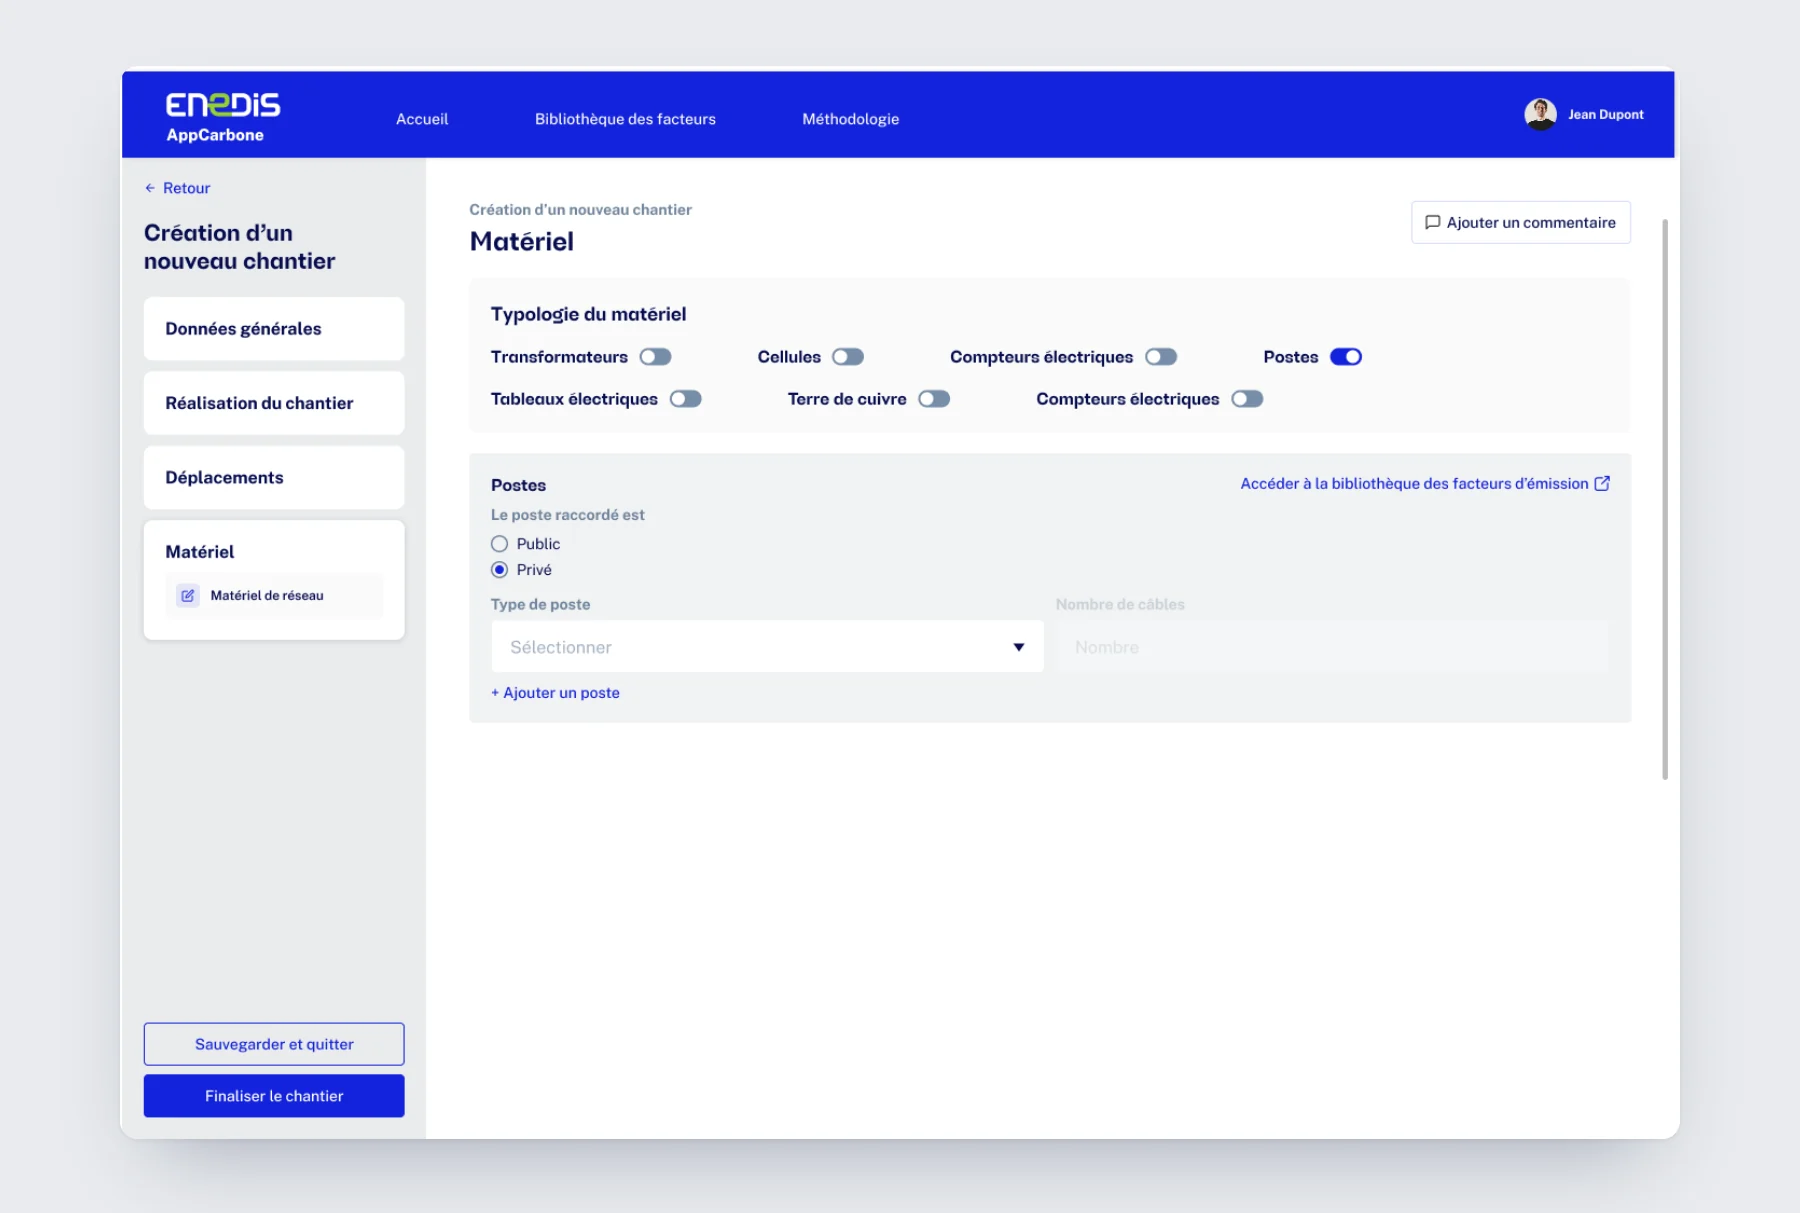
- Project manager
- Turns on the equipment families used, then details substations and switchboards.
- Design choice
- Toggles that only expand the equipment in use, and direct access to the factor library.
Testing a variant without re-entering everything.
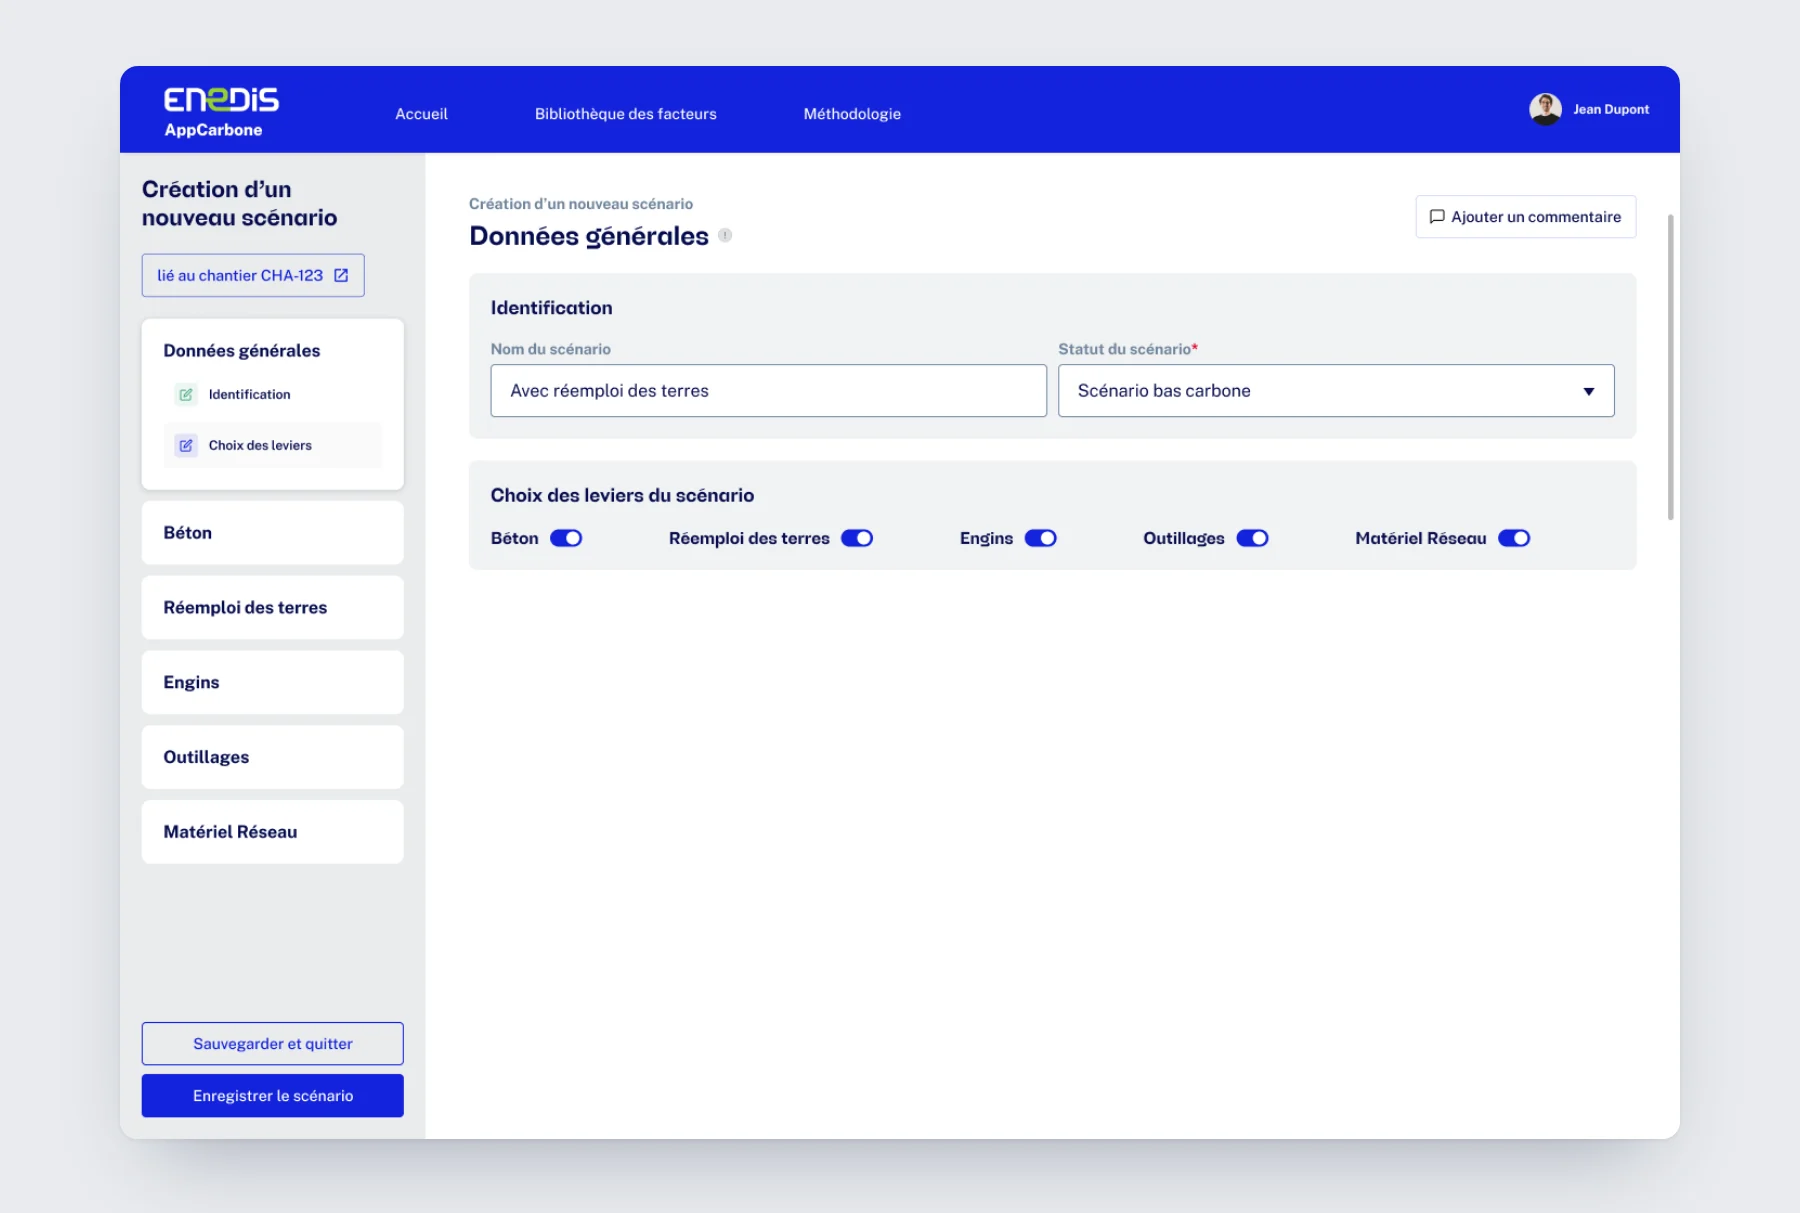
A scenario is linked to its worksite. It only carries the reduction levers to test: concrete, soil reuse, machinery, tools and network equipment.
- Project manager
- Names the scenario, gives it a status and turns on the levers to test.
- Design choice
- Each lever turned on adds its section to the menu. The scenario only shows what differs from the worksite.
- Project manager
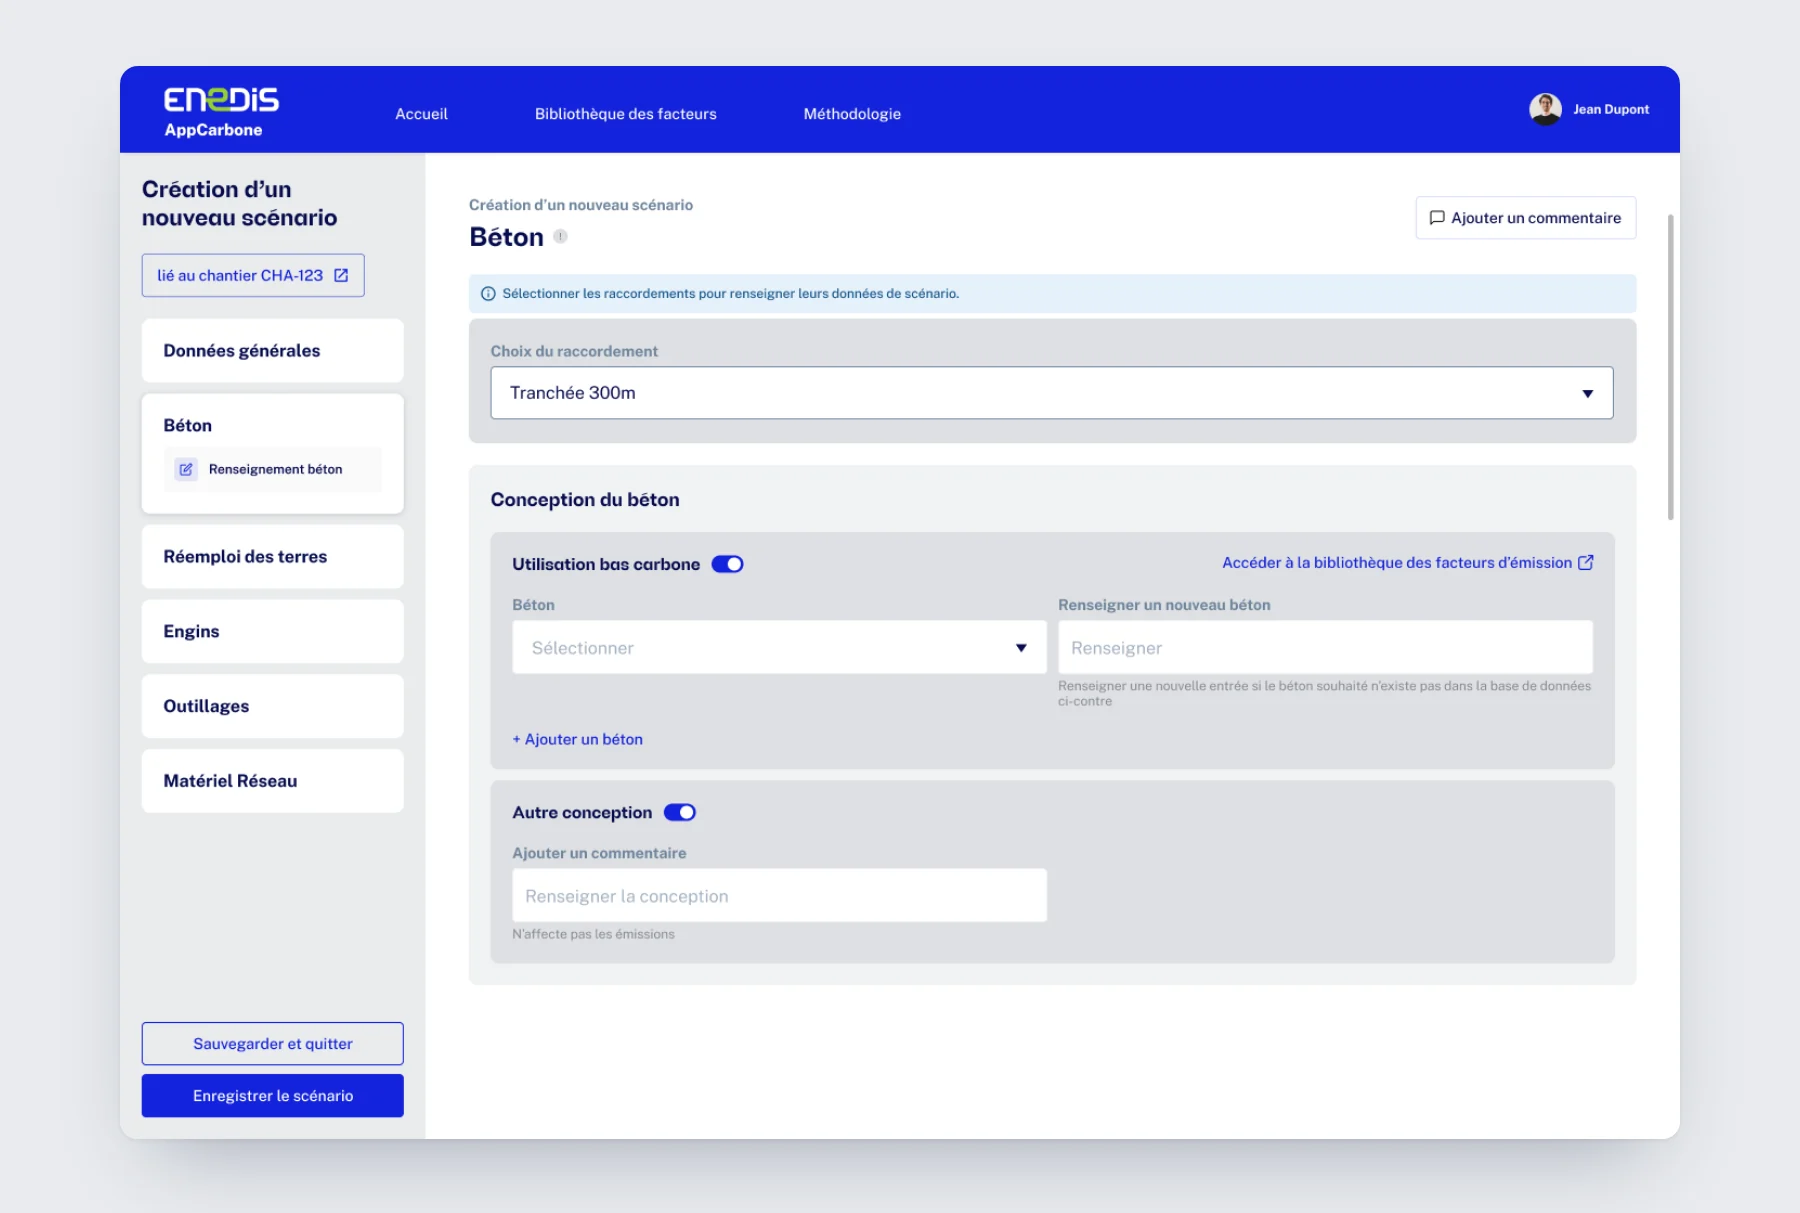
- Picks a low-carbon concrete from the database, or enters a new one.
- Design choice
- Input is done connection by connection. A “Finalized” status in the list shows what's left to do.
- Project manager
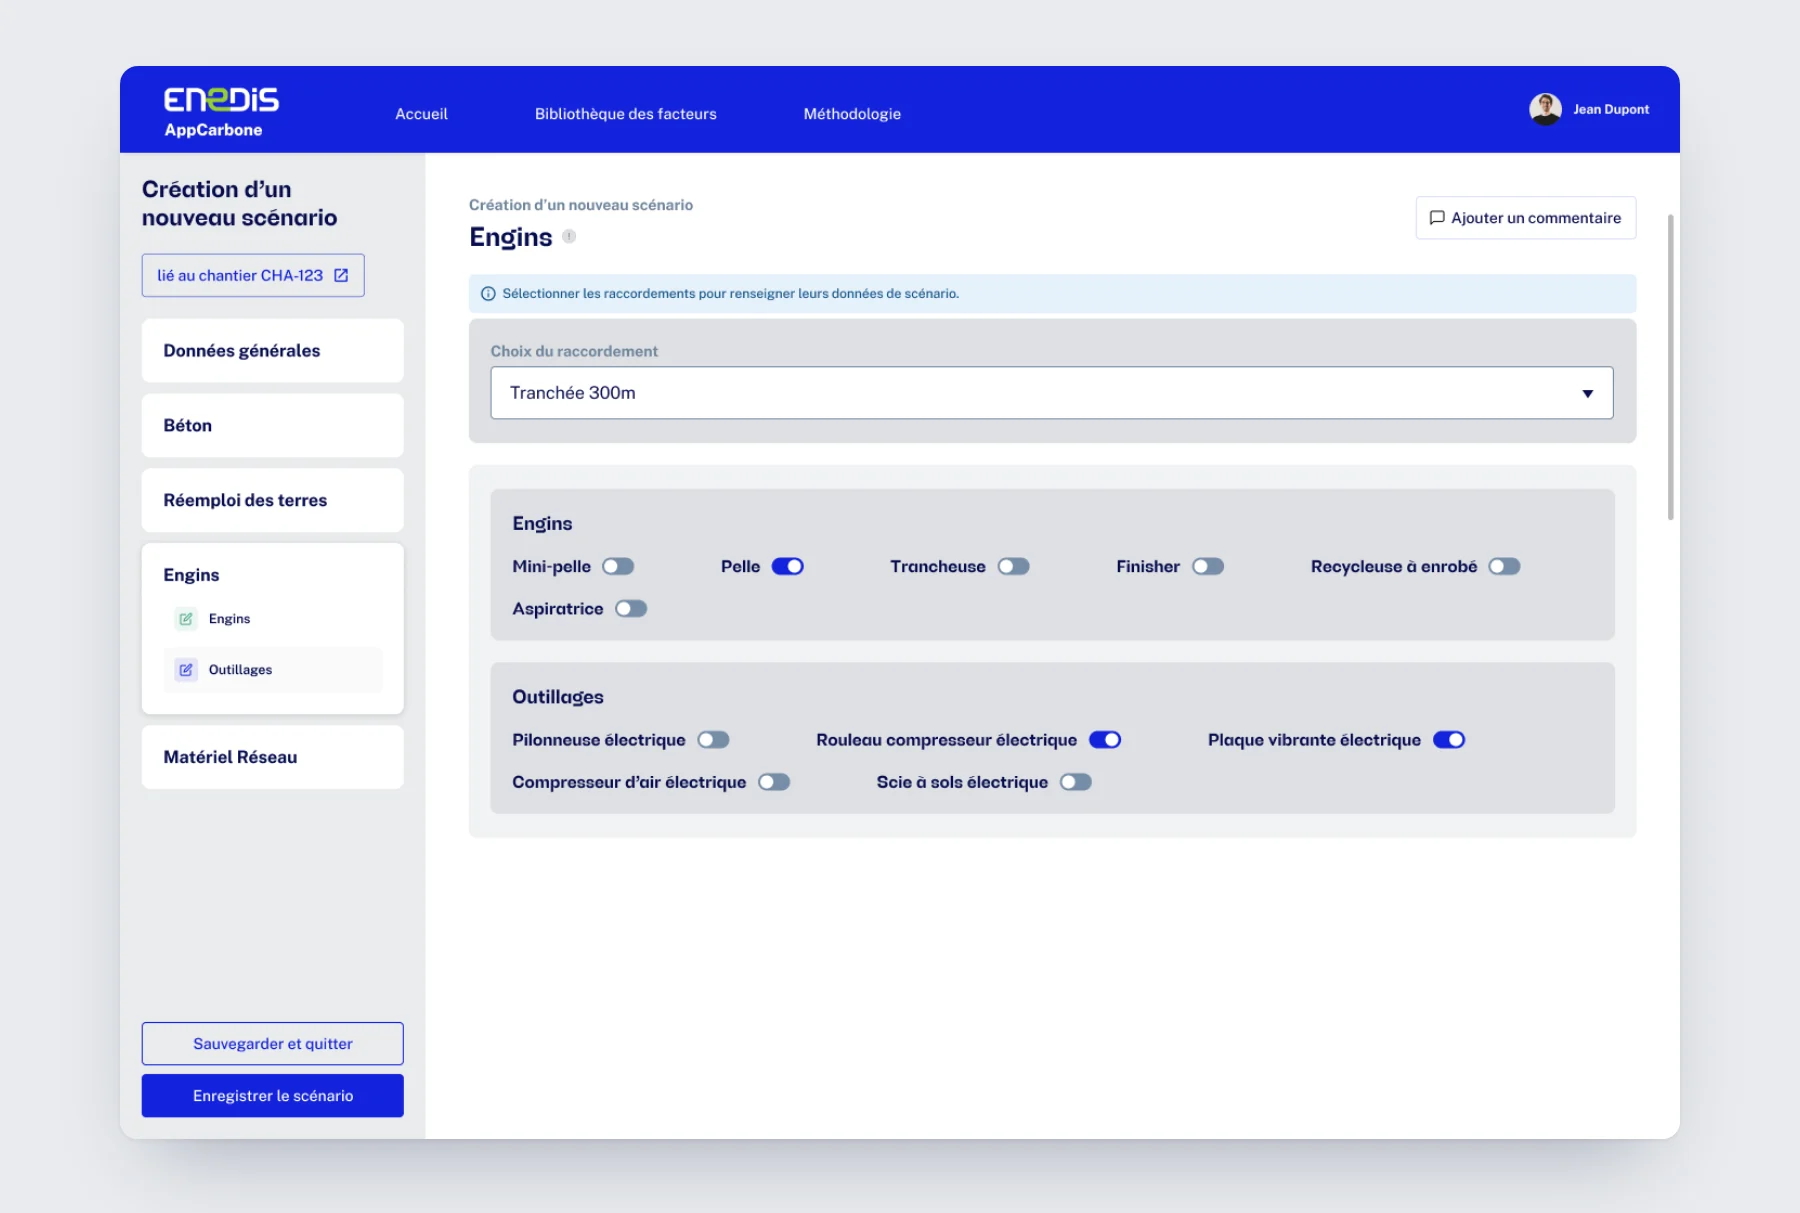
- Selects the machinery and power tools used on the section.
- Design choice
- Toggles instead of a table: equipment is declared in a few clicks.
- Project manager
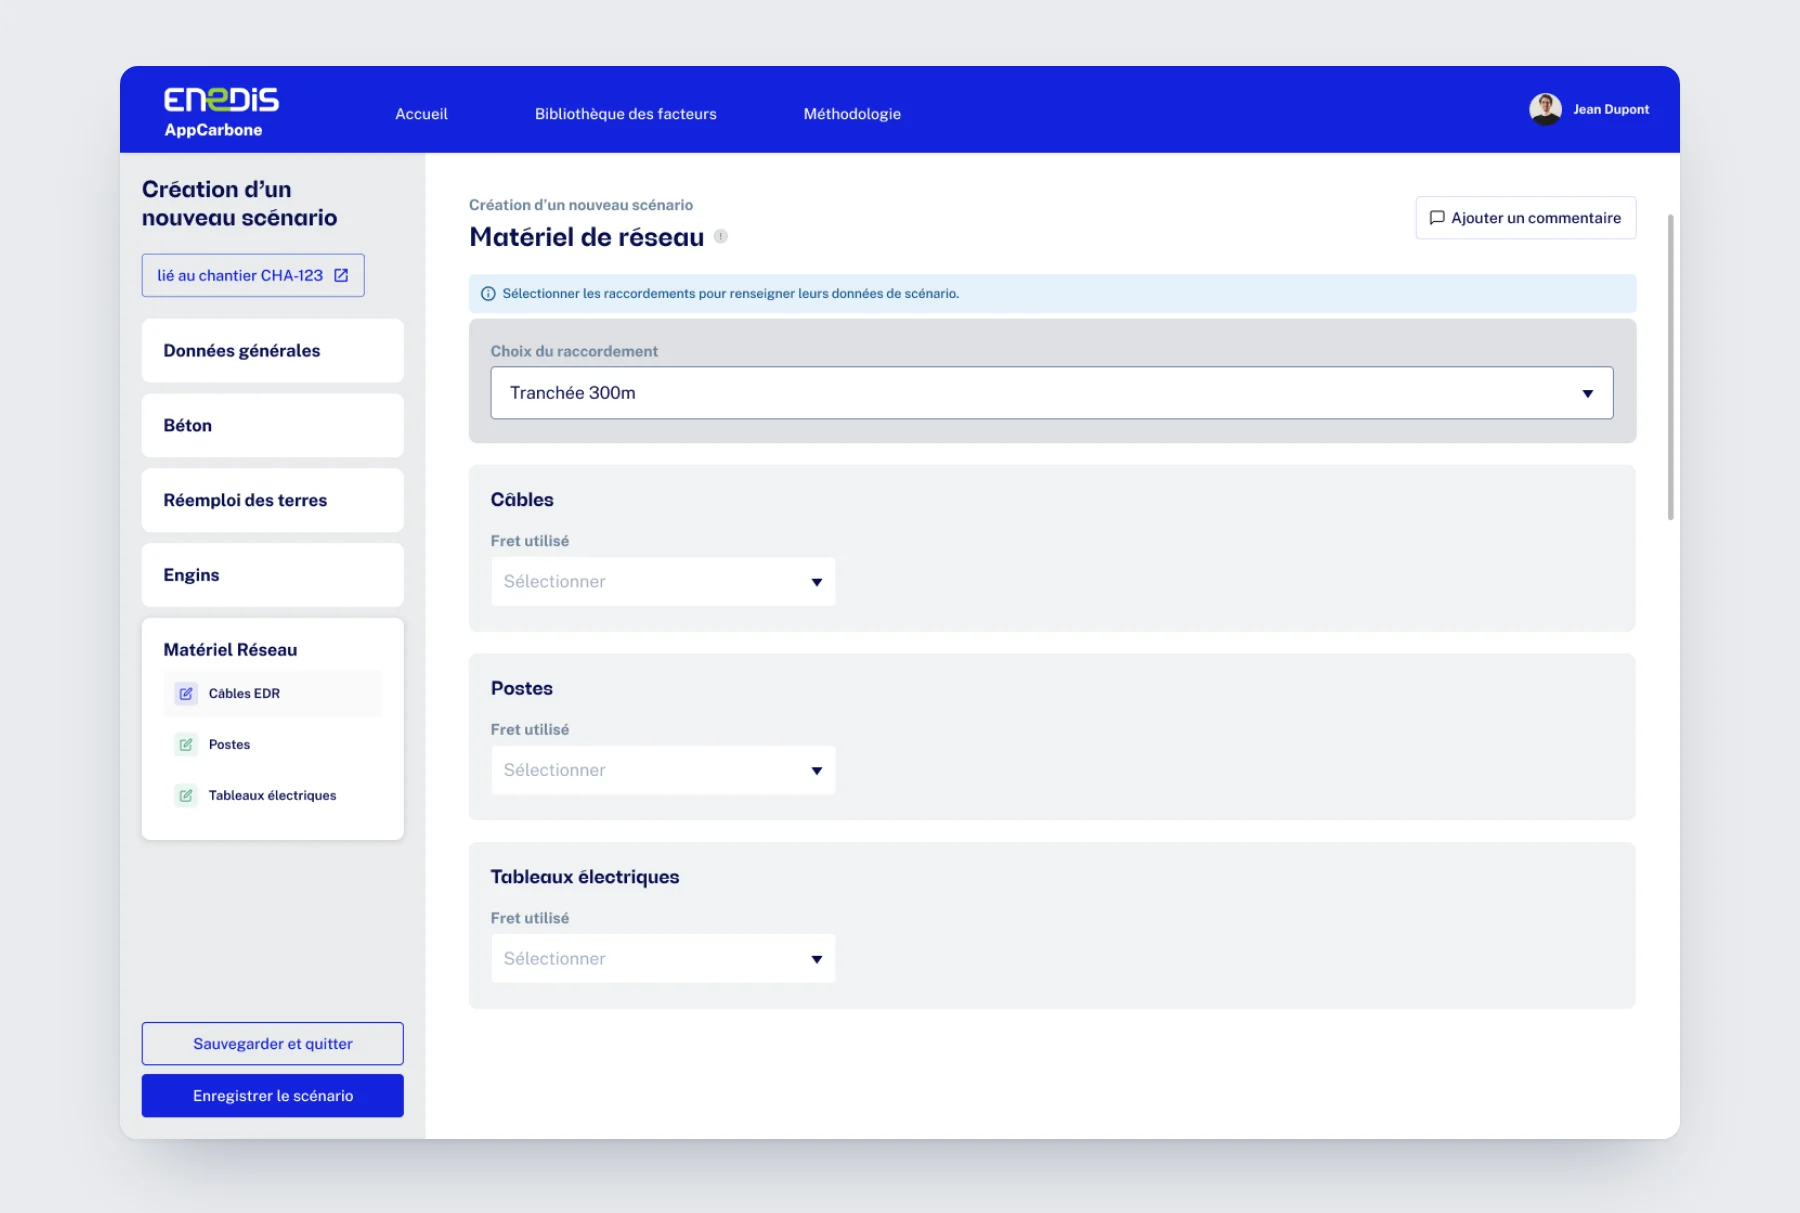
- Indicates the freight used for cables, substations and switchboards.
- Design choice
- The same template from one lever to the next: once the first is learned, the others fill in effortlessly.
The trade-offs that matter.
4 design decisions, and what settled them
For each decision: the chosen solution, the alternative ruled out, and the reason.
Levers turned on as needed
Input per connection
A menu that builds itself as you go
Confirm before finalizing
Charts built for decisions.
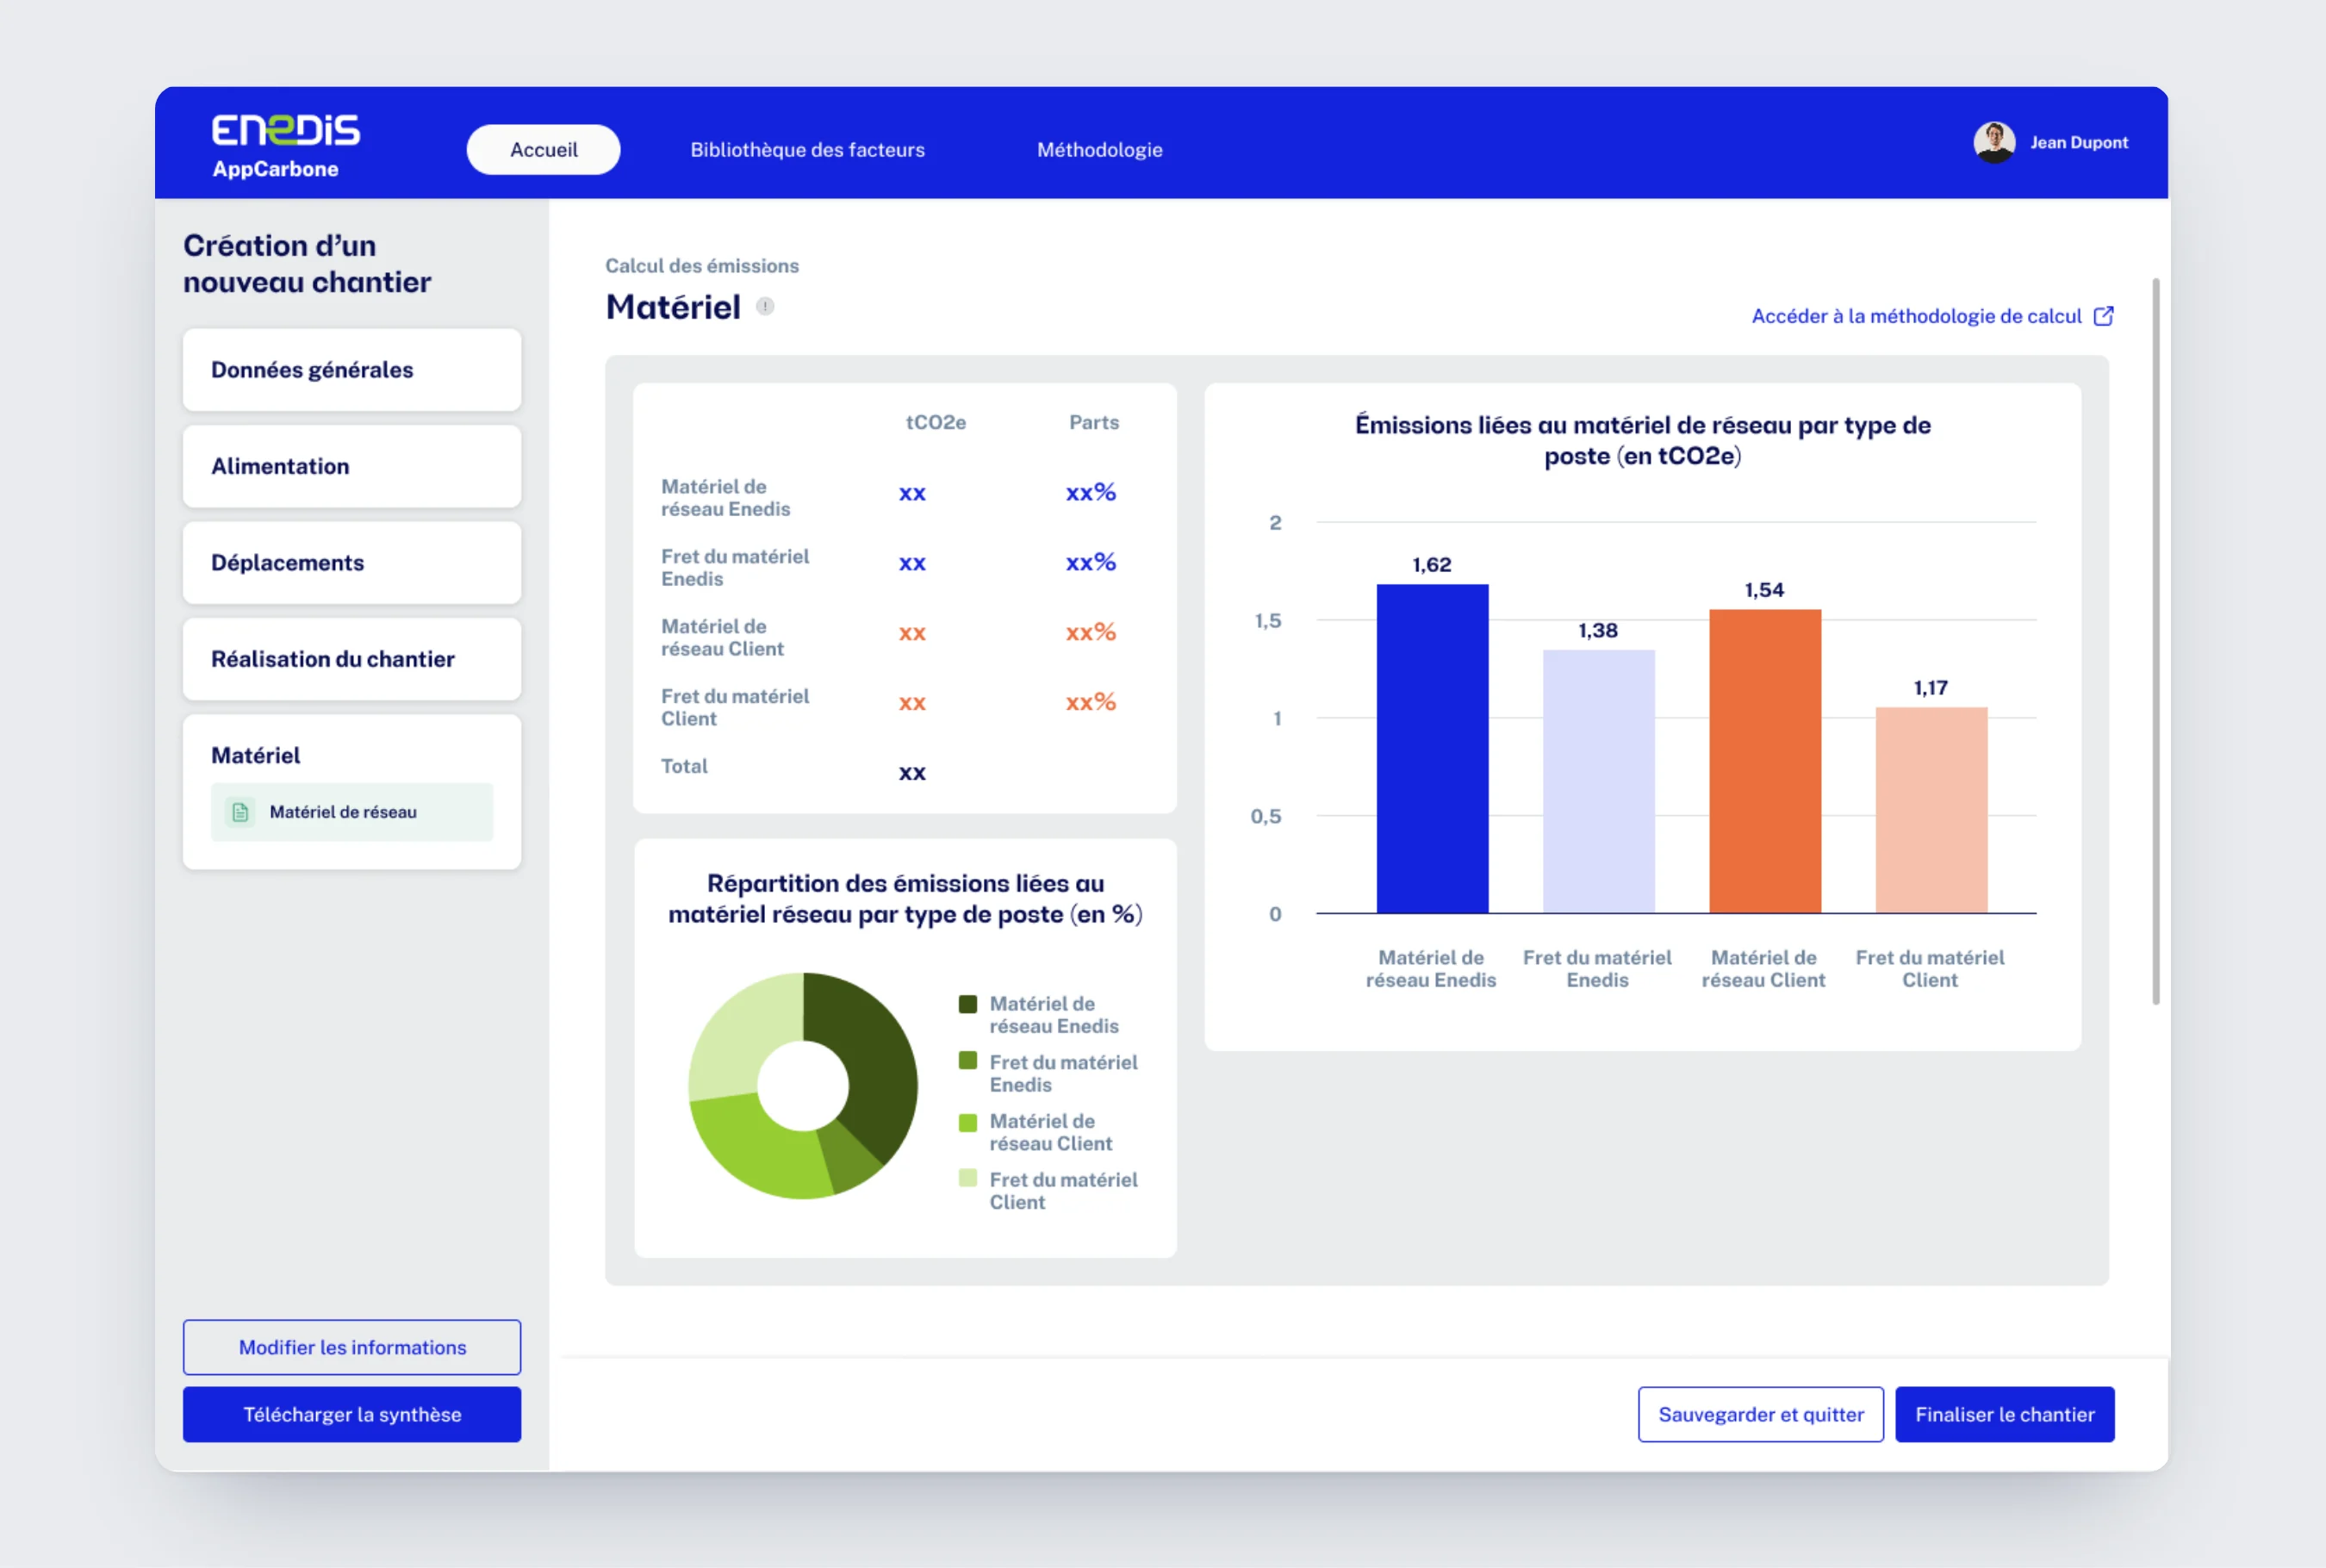
At the end of each category, a summary turns the input into emissions. The same template everywhere: a table for the result, a donut for the breakdown, a chart to compare. You read from the big picture down to the detail.
- 01The result first
The table gives emissions in tCO2e and the share of each item: equipment or freight, Enedis side or customer side.
- 02The breakdown
The donut shows each item's weight in the total, to spot where the lever is.
- 03The ranking
The bar chart puts items side by side: the biggest emitter stands out at a glance.
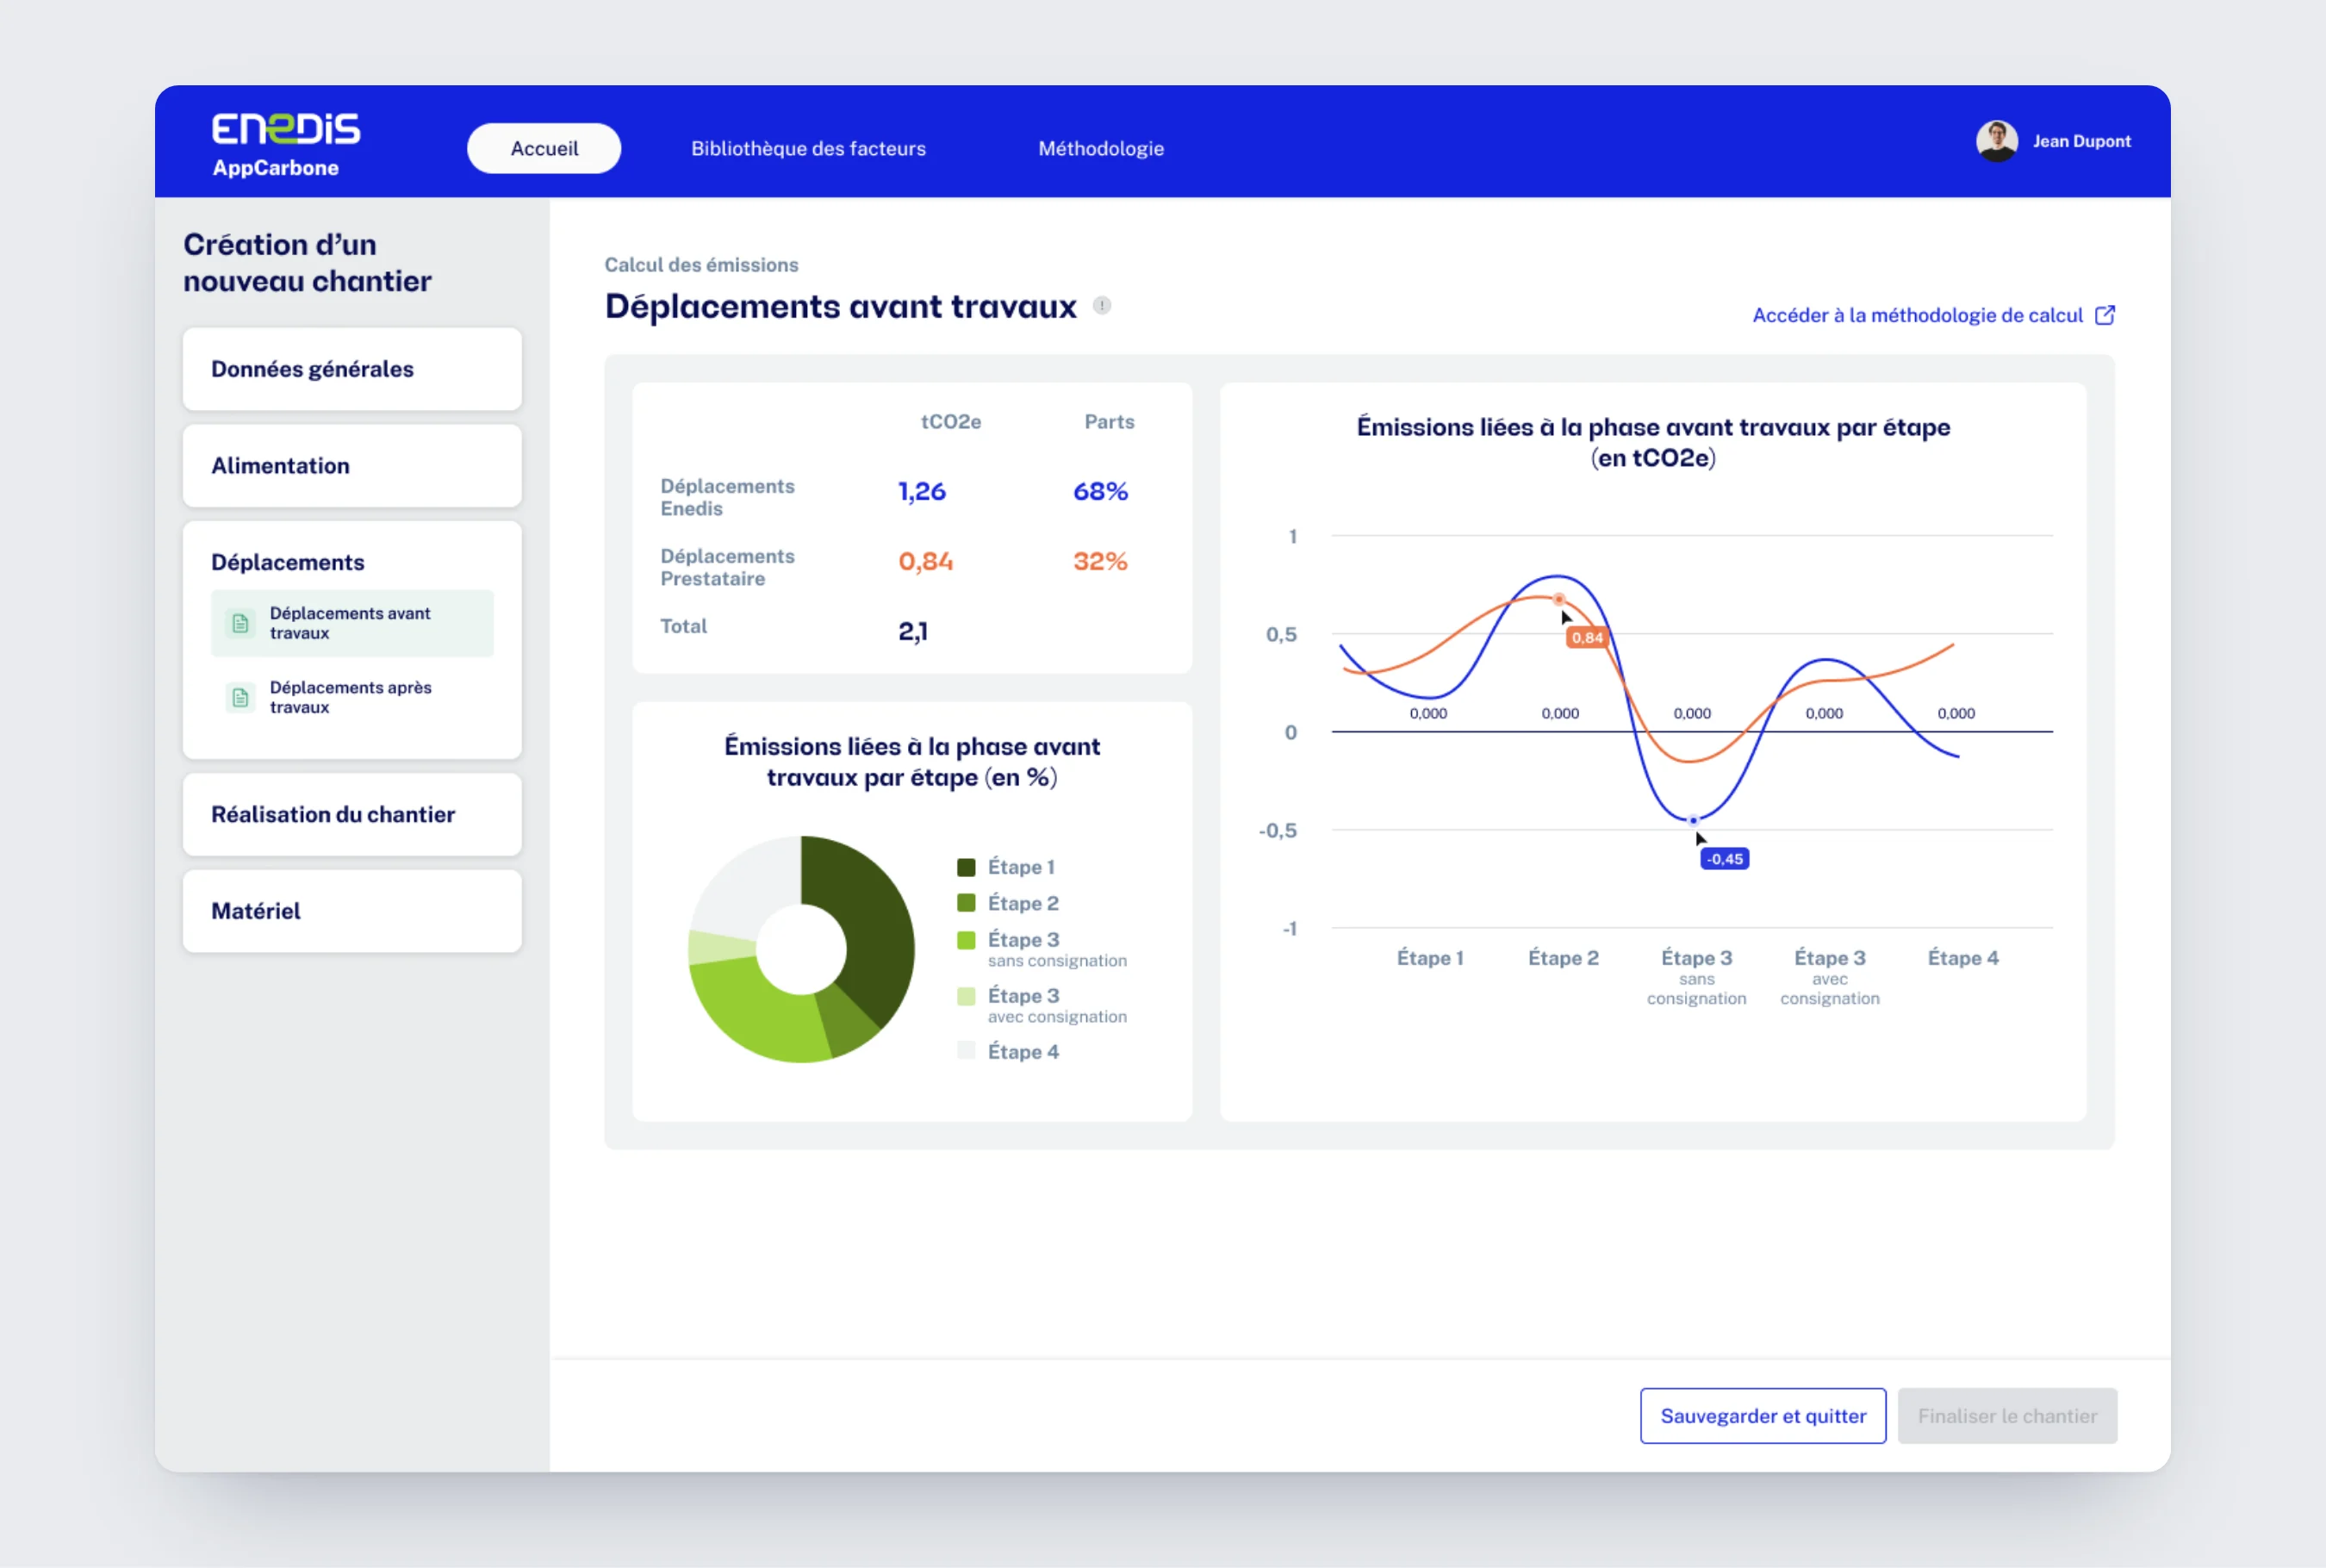
- 01Enedis or contractor
1.26 tCO2e on the Enedis side, 0.84 on the contractor side: each share is readable instantly.
- 02The steps that weigh
The donut splits emissions by step, from survey to staking.
- 03The trend
The line follows emissions step by step and compares Enedis and contractors, with values on hover.
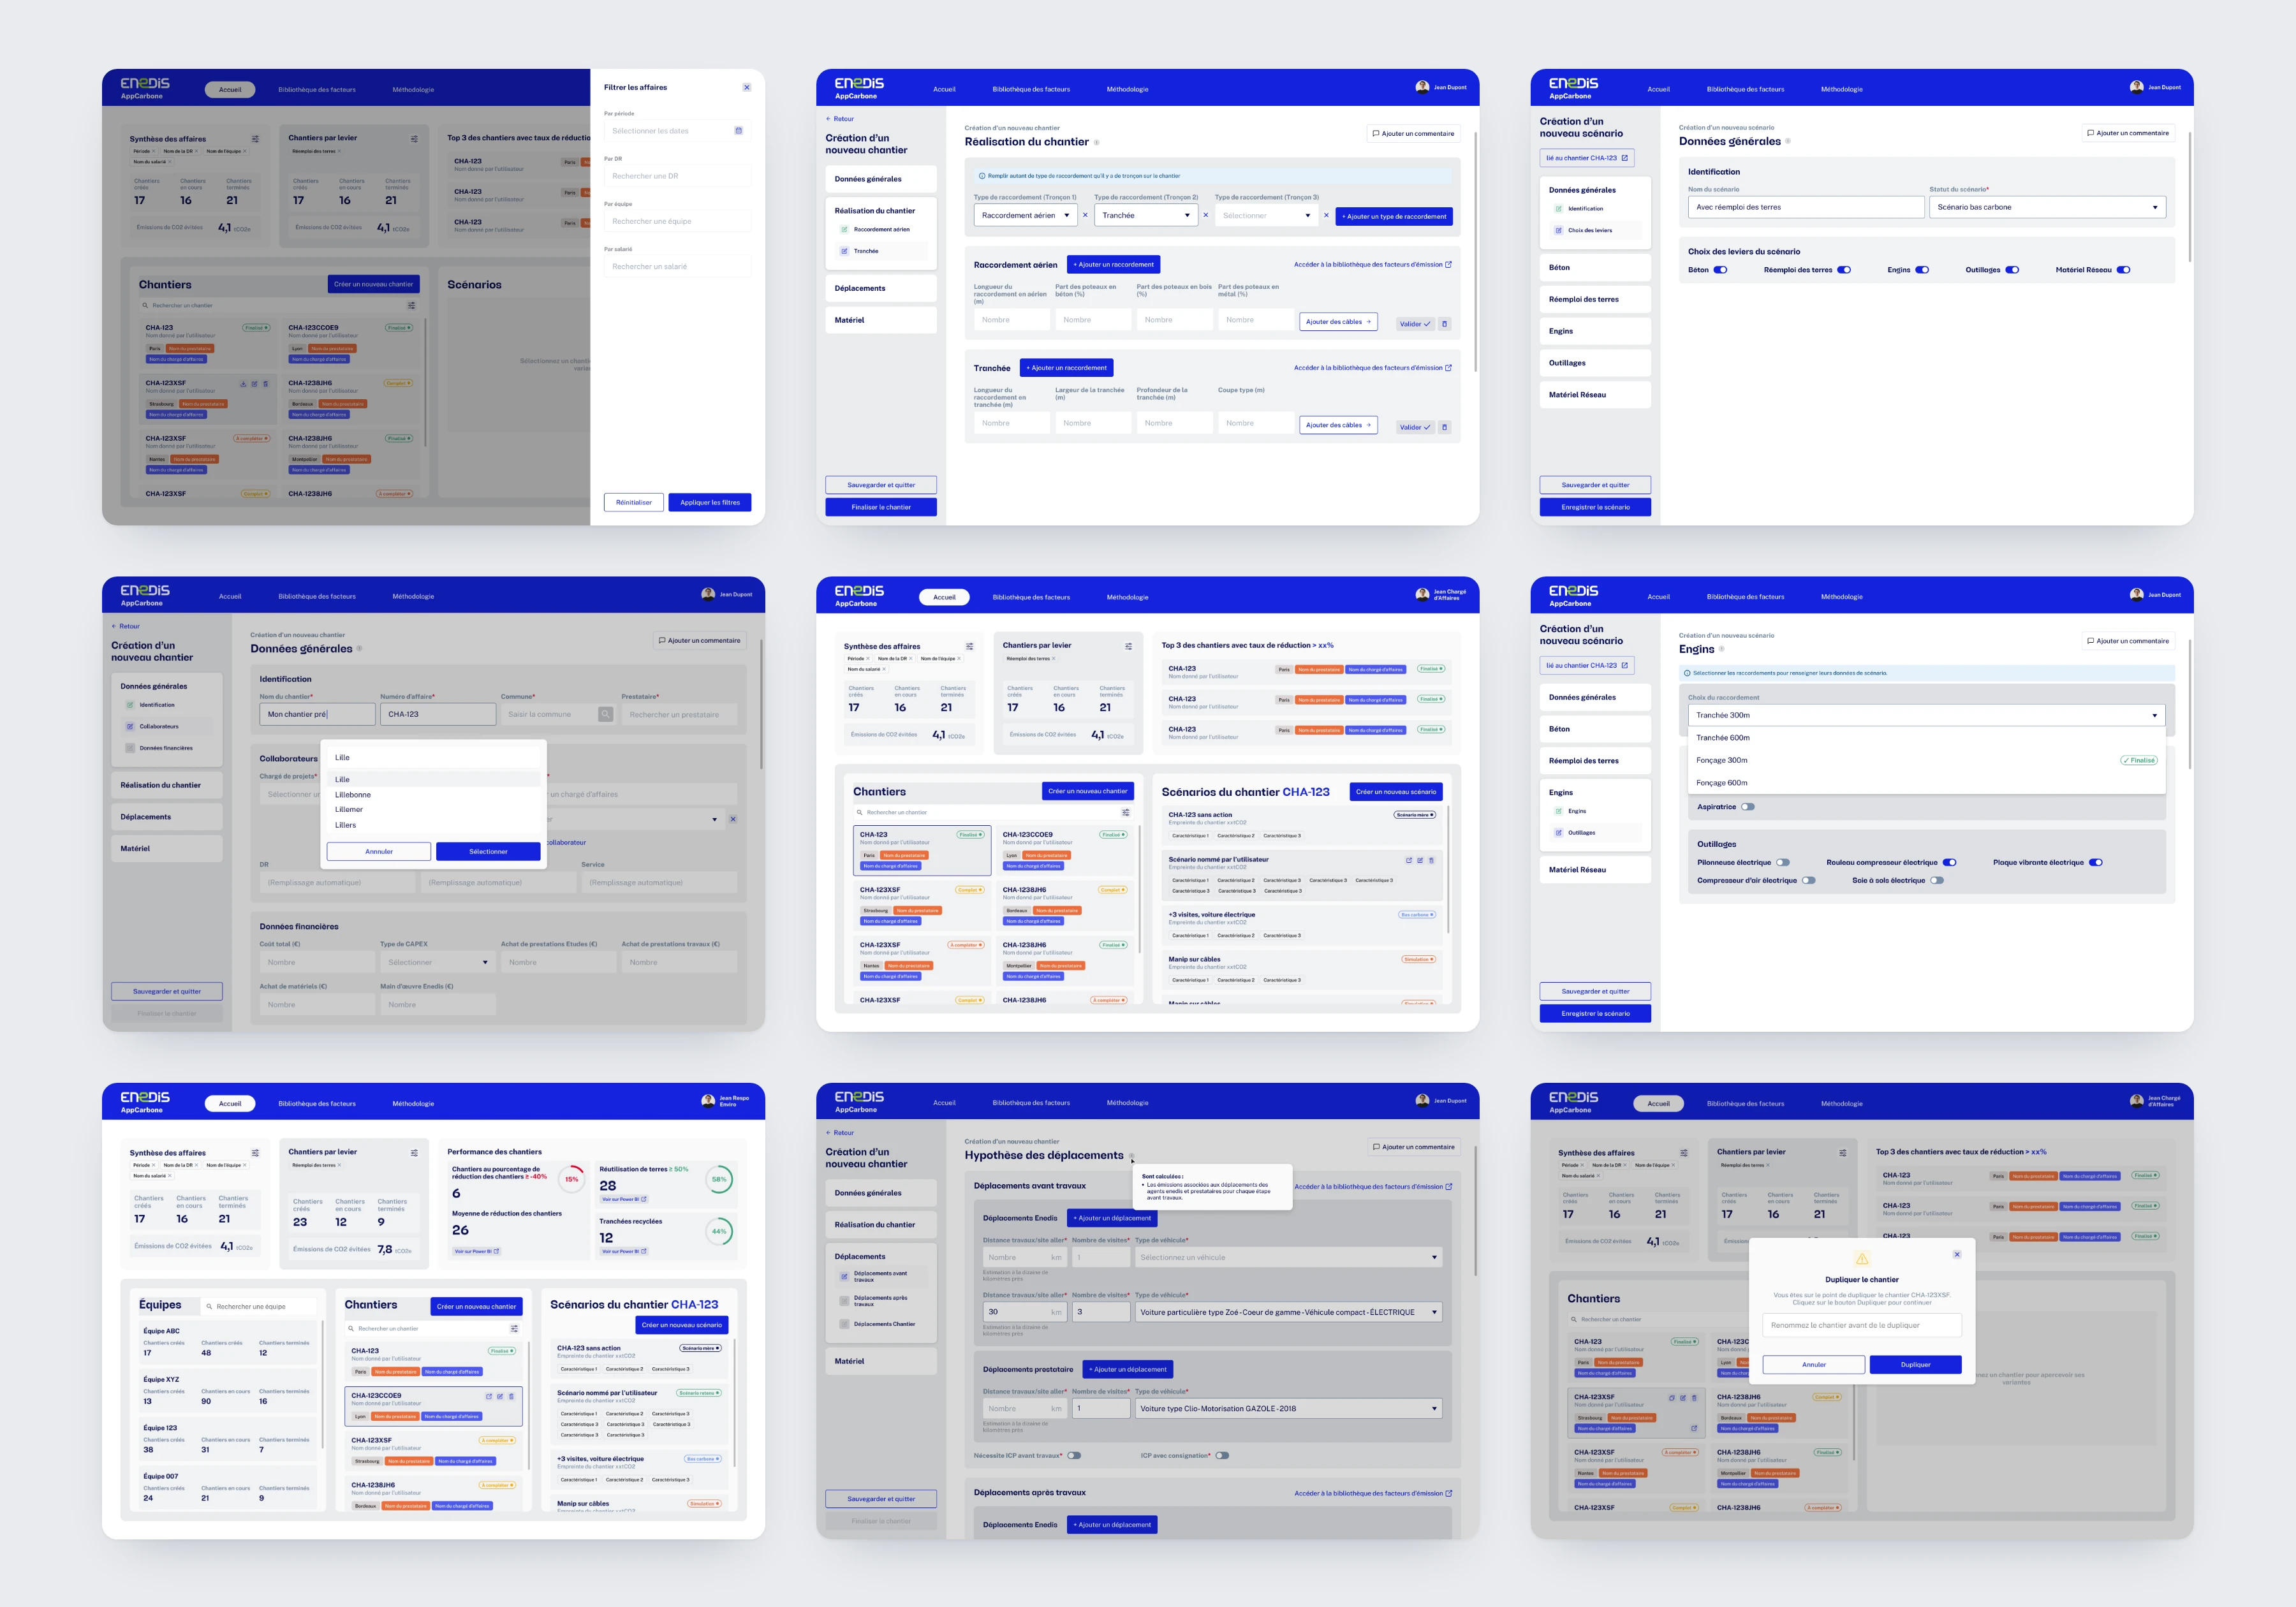
From worksite to scenario.
A real decision-making tool.
What I take away.
Restructure rather than transpose
Reproducing the spreadsheet on screen would have kept its flaws. We had to start again from the tasks.
Data serves a decision
Every chart answers a question: which item emits the most, where to act first.
What I'd do again
Have project managers test the input flow from the very first mockups. A form this size is validated in the field, not just in workshops.