Modernising a critical tool
Enedis's Carbon Calculator is an internal tool used to measure the carbon footprint of construction sites.
Originally designed as an Excel spreadsheet, it had several limitations:
duplication of files to compare scenarios
complex data manipulation
poor readability of results
In a context where environmental issues are becoming strategic, it is essential to have reliable, accessible tools that are adapted to business practices.

A complex and difficult-to-use tool
The use of the calculator was based on a restrictive operation:
duplication of files for each scenario
difficulty in comparing results
complex navigation between tabs
poor readability of data
This operation made the tool:
time-consuming
difficult to get to grips with
ill-suited for large-scale use
Designing a unified business application
To address these challenges, we designed an application to transform the carbon calculator into a comprehensive digital tool.
The solution is based on several pillars:
centralisation of data
simplification of user journeys
clear visualisation of results
adaptation of the interface according to profiles
The objective is to offer a seamless experience, allowing users to create, compare, and analyse carbon scenarios efficiently.

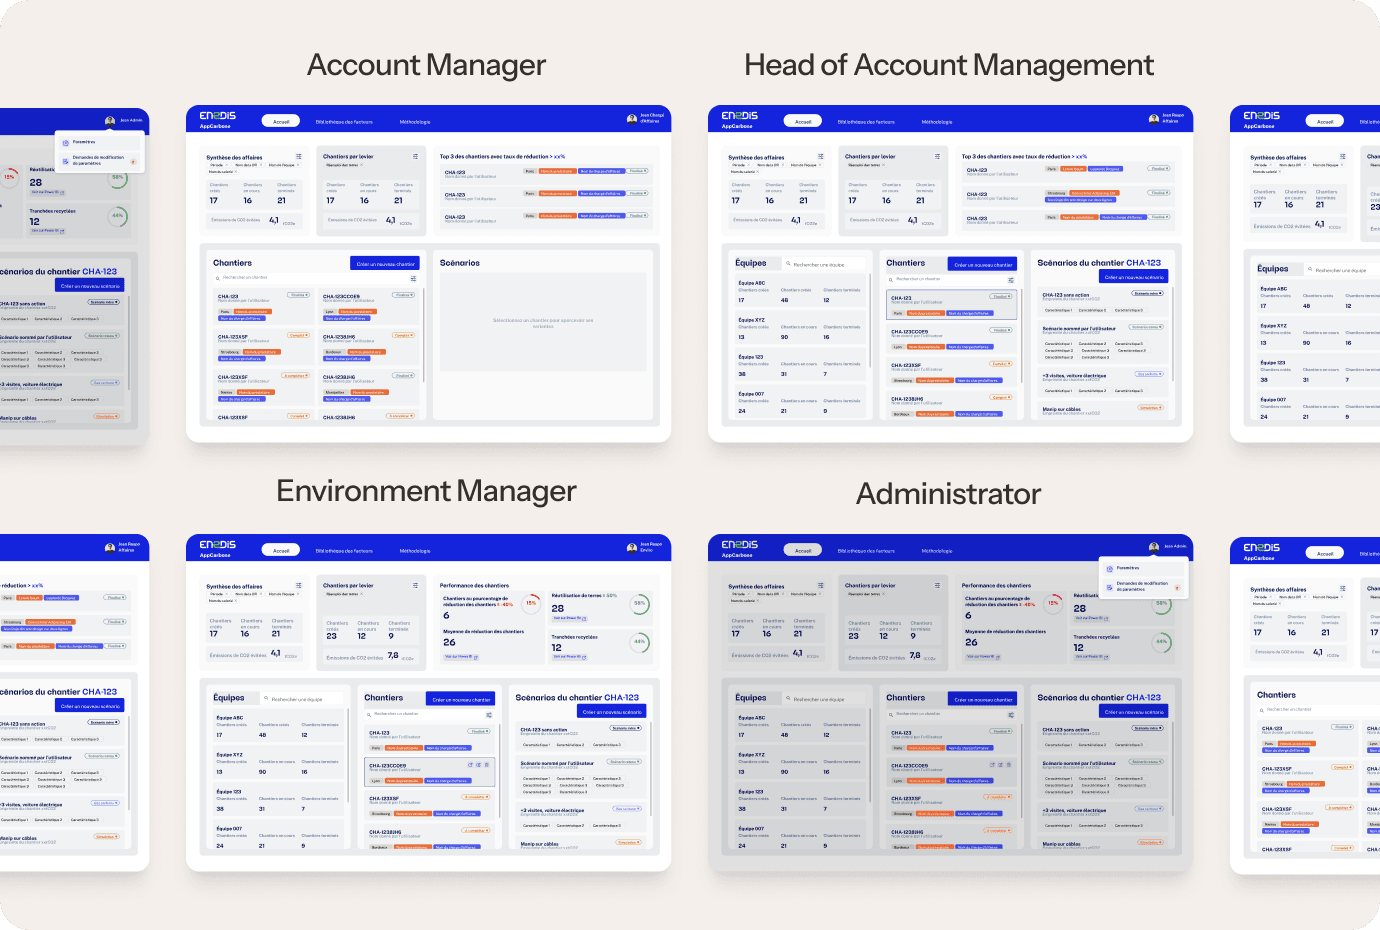
Structuring a multi-role product
The application was designed to meet the needs of several business profiles, each with specific responsibilities:
Business Manager: creation and management of sites and scenarios
Head of Business Managers: team supervision
Environment Manager: carbon performance analysis
Administrator: system and settings management
Each user automatically accesses an interface tailored to their role, ensuring a personalised and relevant experience.
Simplifying complex journeys
The application opens on a central dashboard allowing users to:
visualise ongoing projects
access construction sites
consult the associated scenarios
analyse performance
This choice provides an immediate global overview and accelerates decision-making.
Creating and comparing scenarios
One of the major challenges was to simplify the creation of scenarios.
In the new experience:
scenarios are linked to a construction site
they can be easily named and compared
their carbon impact is directly visible
This avoids files duplication and facilitates analysis.
Clear data management
The data has been entirely restructured to improve understanding:
separation between construction site data and scenario data
grouping into sub-categories
simplification of input fields
Result: better readability and a reduction in errors.
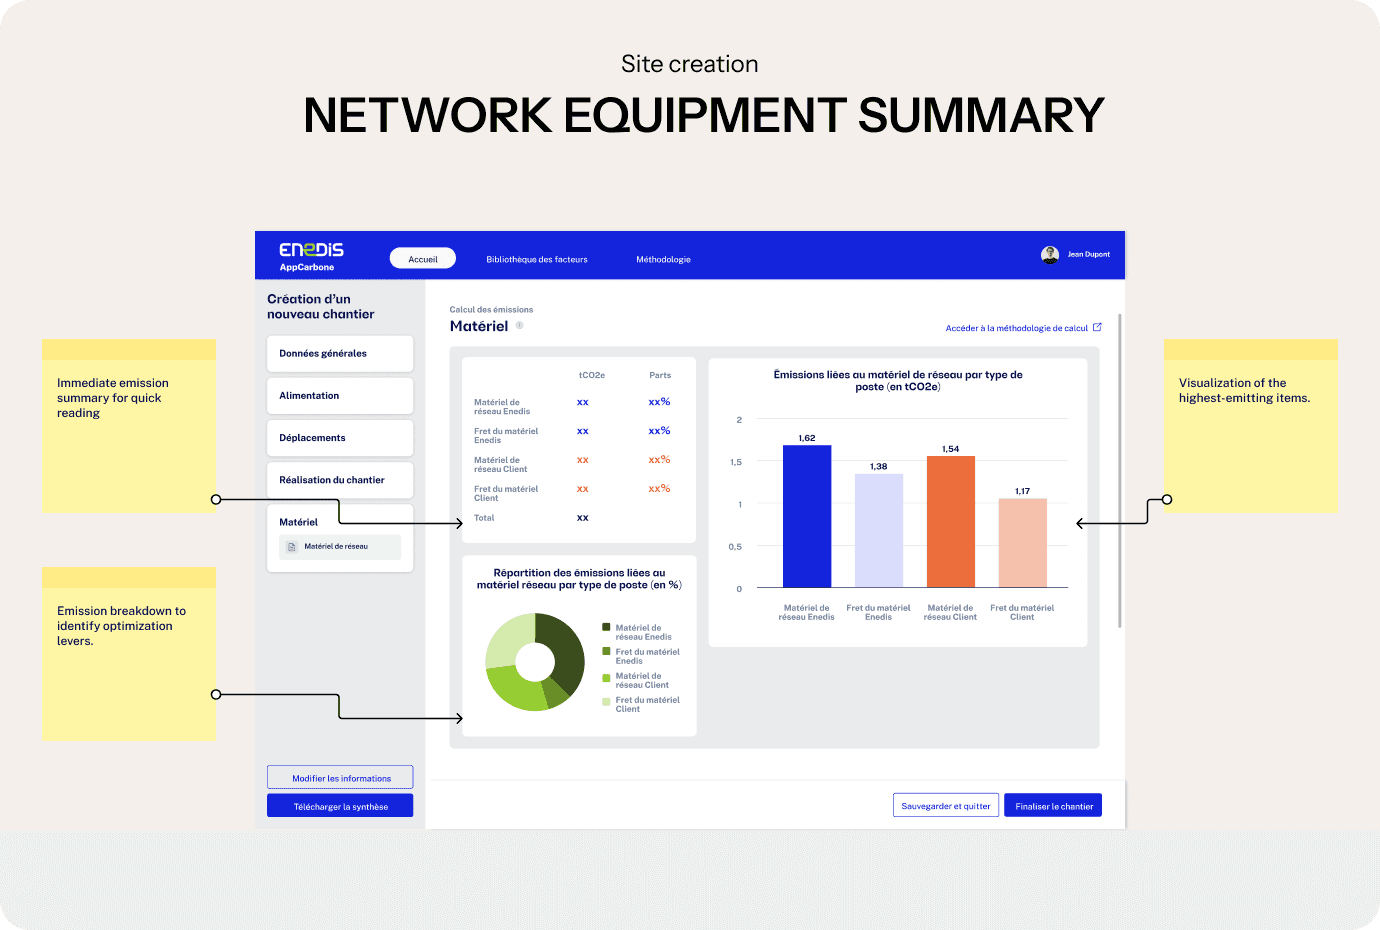
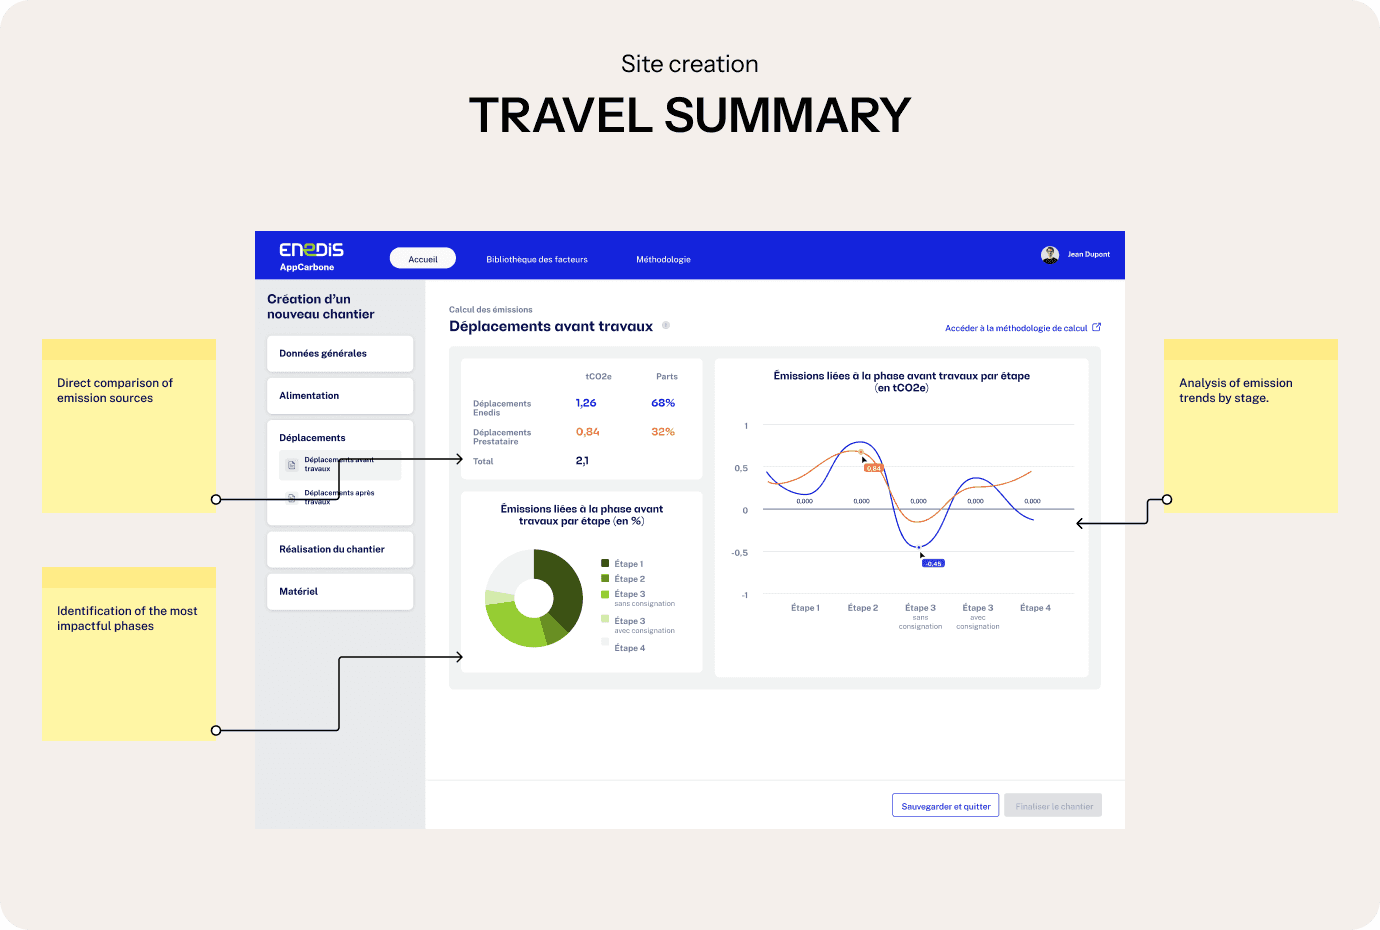
Rethinking access to information
The content originally present in the Excel tabs has been redistributed:
explanations integrated in the form of tooltips
technical data accessible via dedicated databases
summaries visualised directly via dashboards
The objective: to make information accessible without overloading the interface.
An optimised business experience
The transformation of the carbon calculator has made it possible to:
simplify user journeys
improve data readability
reduce duplication of information
facilitate the creation and comparison of scenarios
offer an experience tailored to different profiles
The tool thus becomes a genuine support for environmental decision-making.